Configured for a Long Journey

In a development that would have seemed unlikely back in April, the U.S. economy continues to expand, and equities have staged a powerful rally. The most significant contributor to the equity rally has been the shift in focus—from fear of a looming recession to a more optimistic view unfolding across several key themes, specifically the outlook for interest rates and earnings.
Because the move has been so swift and powerful, it is worth questioning whether it can be sustained. Given the importance of the technology, comparisons arise to the late 1990s tech boom and bust. Today, valuation levels remain at the upper end of normal, rather than at the extreme levels reached in the 1990s.
Around the time the internet-driven equity market was peaking, the classic Boeing 747 aircraft, with its four-engine configuration, was being overtaken in deliveries by the Boeing 777. The new plane had only two engines, but they were specifically designed for high reliability and efficiency over long distances. Not to be outdone, Airbus developed a two-engine, ultra-long-range plane capable of flying what is now the world’s longest commercial flight. This flight, SQ23 from New York City (JFK) to Singapore (SIN), travels 9,500 nautical miles in about 19 hours and is about 30% longer than the longest 747 flight.
An important question facing us today is whether the current rally in asset prices is running out of fuel or whether it is configured for a long journey. While valuations pose a serious threat, the course will be determined by the two powerful engines of rates and earnings.
Engine #1: Interest Rates
Due to a stubborn inflation backdrop and fears over tariffs, Fed policy has been restrictive. Now, with a slowing but stable employment backdrop, the balance is shifting as the Fed moves towards a less restrictive stance, which will extend the cycle of economic expansion.
Stubborn Inflation & Surprisingly Benign Tariffs
We see two positives and one negative when assessing the current level of inflation. After peaking at 9.1%, inflation has declined significantly to now, remaining in the 2.3%-3.0% range, which is clearly a positive development. However, that improvement doesn’t get inflation back to the Fed’s official target of 2.0%. The slow-moving shelter (housing) component is partly to blame. As more time passes, this failure to achieve inflation objectives could be viewed negatively. Finally, at the announcement of tariffs six months ago, many professional forecasters anticipated a significant increase in inflation. The fact that this has not occurred is certainly a positive development.
Our model for tariff pass-through inflation considers the specifics of the policy as applied to each country and product. We also estimate potential changes in buying patterns. Next, we assess the options available to corporations: passing along the increased cost, absorbing the extra cost via reduced profit margin, or making adjustments elsewhere to offset the increased cost (an underappreciated element of the story). We expect inflation to gradually increase a bit more, but not to a level that would be problematic for Fed policy.
Labor Market Slows but Remains Steady
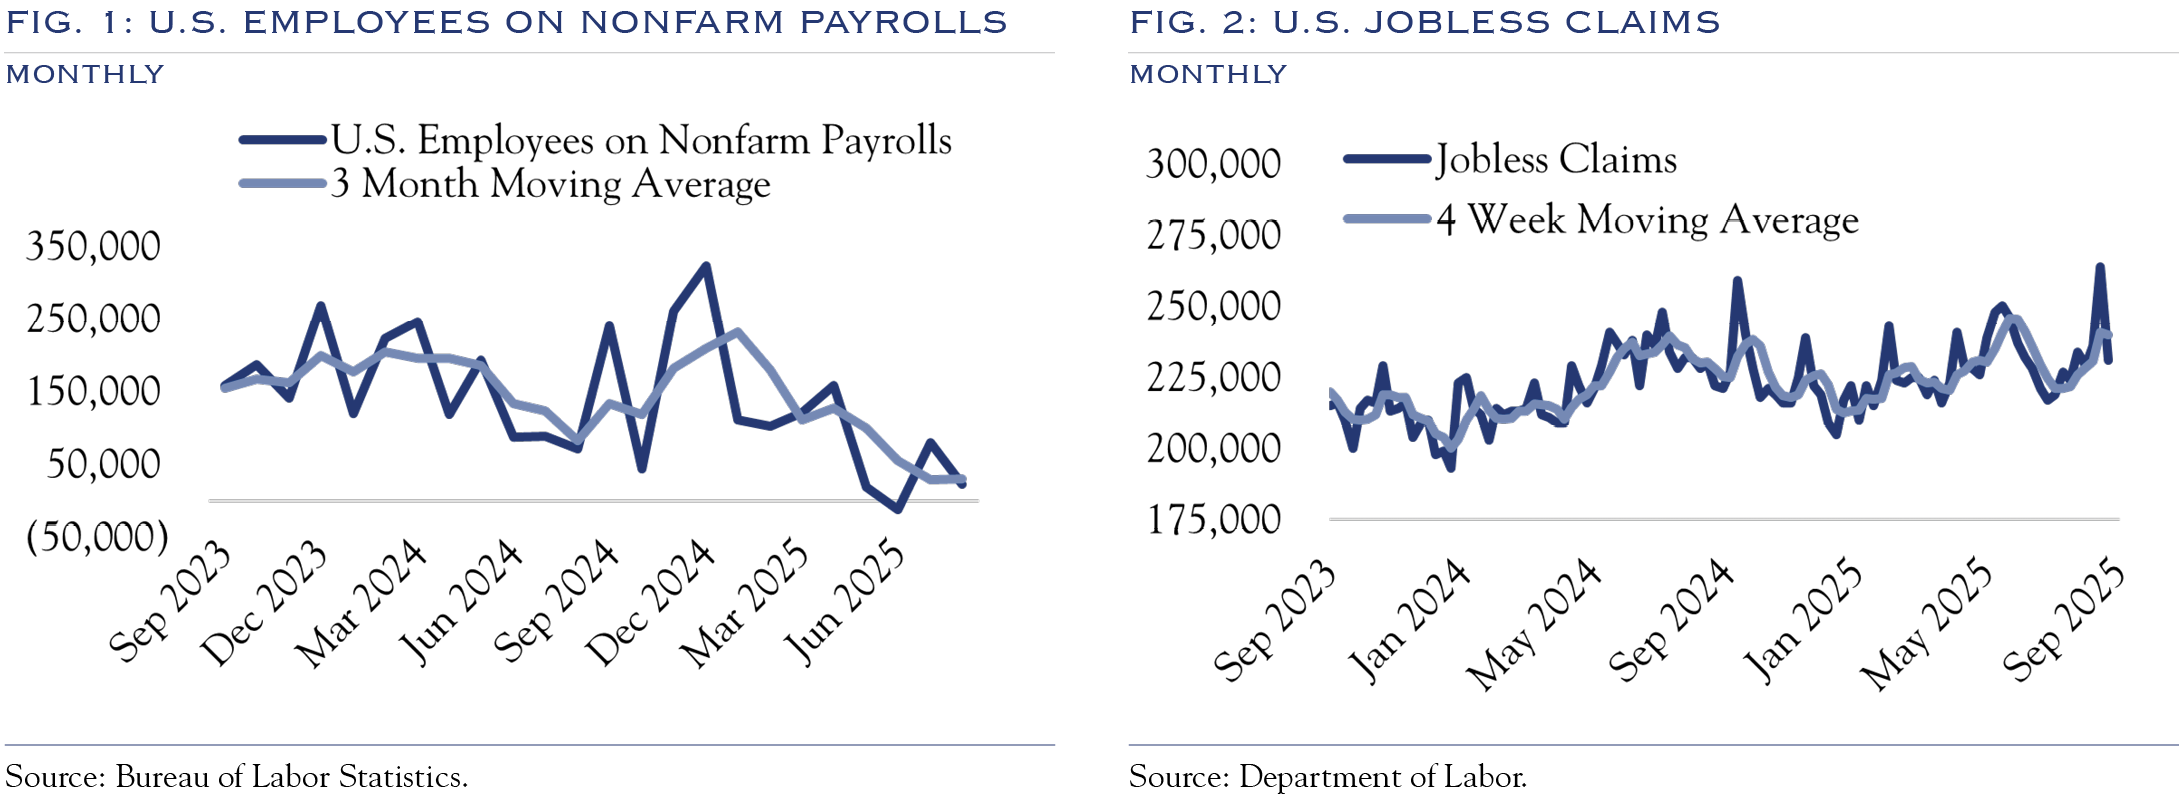
Although job gains are slowing, the economy remains on stable ground, as evidenced by continued robust reports on consumer spending by high-income and middle-income demographics.
Using a three-month trend to review the past 30 years, only 13% of quarters have seen an increase in unemployment and jobless claims occur alongside an increase in earnings. In sum, the current configuration of labor market weakness coinciding with rising earnings is a relatively rare phenomenon.
For now, payroll expansion and wage gains are enough to keep the economy on solid ground. We estimate that a +3.7% wage gain and a +3.2% Hires rate, less the CPI of 2.9%, will result in a potential spend of +4.0%.
The substitution of technology for labor is likely to be an essential ingredient that will allow margins to remain robust. However, we expect employment growth to slow further as companies must balance the pressure from tariffs with the opportunity to boost productivity.
This also means that AI is helping to mitigate the inflationary pulse from tariffs. Faced with increasing input costs, the option of becoming more productive is superior to either passing the expenses along or absorbing them through lower margins.
Looking ahead, we anticipate more of the same: a stable growth backdrop and continued margin and earnings expansion, despite a slowing labor market and some upward inflation pressure.
Team Powell wins in “The Summer I Cut Interest Rates.”
Rate cuts are rare when fundamental metrics are as strong as they are today. Yet, after a long wait and facing significant political and market pressure, the Federal Open Market Committee voted to reduce the Fed Funds rate by 25 basis points. Both the extended pause and the recent cut should be considered victories for Chair Powell. He kept the committee mostly united around a policy of waiting to build confidence in their assessment and understanding of the effects of tariffs, and was able to enact a 25-basis-point cut with only one dissent in favor of a 50-basis-point cut. Chair Powell also managed the communications challenge well, clearly articulating the case for removing some restrictiveness and retaining policy flexibility for future meetings.
Yields on the benchmark U.S. Ten-Year Note serve as an essential input to models for estimating economic growth and valuation metrics. The current stretch with yields above 4.0% is somewhat unusual in recent history. For two years before the Global Financial Crisis, yields mainly ranged between 4.0% and 5.0%. However, a more appropriate analogy for current conditions is the brief stint of yields above 3.0% during 2018, which ended in 2019 with the economy softening slightly and markets selling off, before the Fed cut rates to alleviate the pressure.
Today’s conditions raise the same essential question: What is a sustainable neutral posture for the Fed Funds rate and related bond yields? With the post-pandemic surge in economic growth and inflation, the Fed’s posture has kept the Fed funds rate above 4.0% since it first crossed that mark during the rate hike cycle in 2022. After a series of rate cuts, the Fed, troubled by stubborn inflation, stayed on pause at 4.5% for most of 2025. Responding to that Fed policy, yields on the U.S. Ten Year have averaged 4.13% over the past three years.
We expect that Fed policy and market rates will converge around 3.0-3.5% by the summer of 2026, extending the runway for economic activity and providing support for above-average equity market valuation metrics.
While the process may be lengthy and unpredictable at times, interest rates will move lower, led by gradual reductions in the Fed Funds rate. This will provide support for valuations that remain elevated.
Engine #2: Earnings
Just as an airplane can fly on one engine if needed, earnings growth has been a powerful driver of equity returns and will likely continue to be a major contributor to gains.
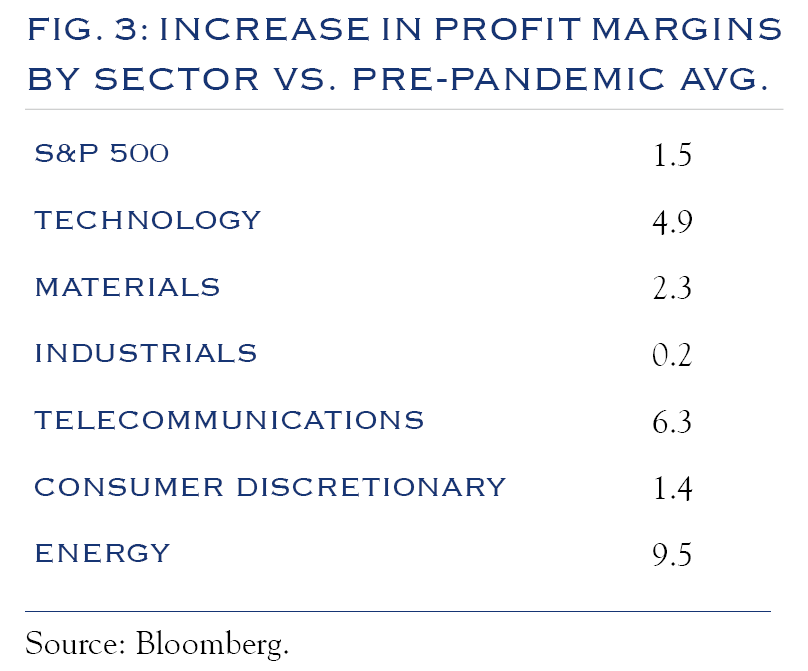
An essential contributor to earnings gains has been increased profit margins. Every time margins reach a peak, companies find a way to boost profits even further. In recent years, much of this strength has come from the tech sector, which leads the way in a comparison of profit margins vs. historical norms.
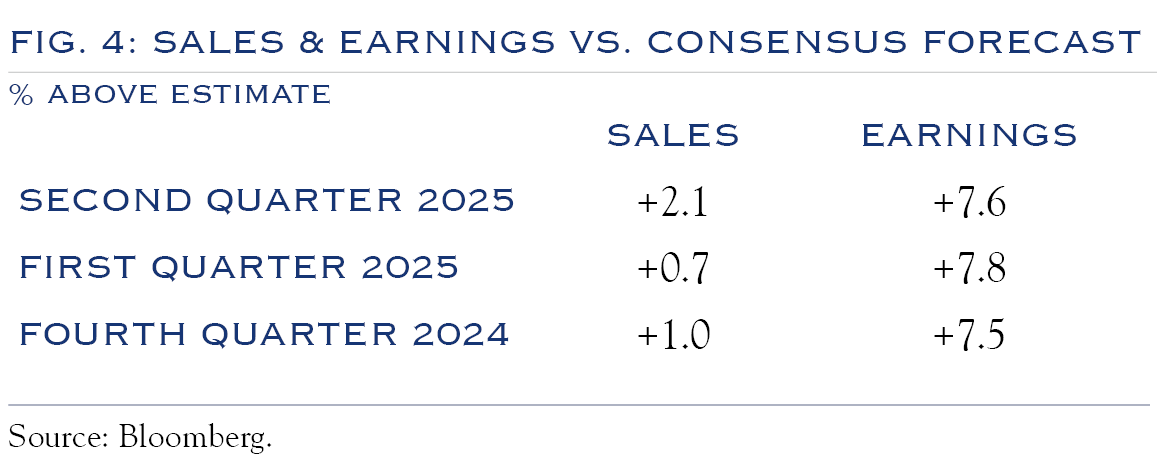
In recent years, a common outcome of earnings season has been sales figures that are mostly in line with estimates, while earnings exceed estimates by a meaningful amount. This suggests that analysts are doing a fine job of estimating revenue (not too surprising, given that economic growth has been reasonably stable), while consistently underestimating the profit potential. The margin growth story has been under-appreciated by analysts.
We identify two primary reasons behind this boost in productivity—first, the follow-on effects of experiences during the pandemic. Often, crises spur innovation, and following many years of a relatively stagnant economy, the bust-boom cycle jolted companies into action. Secondly, advances in technology, particularly through robotics and AI, enable companies to do more with less. While large language models (LLMs) are often the most common tool associated with AI, the implications are much broader. Simply put, more data, more computing power, and new mathematical models are driving innovation. Research from Eric Brynjolfsson(1) and Mike Mauboussin(2), as well as our initial model, all point to a long journey of increasing innovation and productivity. This bodes well for future profit margins. As costs decline and applications become more widely utilized, those advances in productivity will spread beyond the “first movers”. Our thesis on AI and markets has been that the focus will shift over time from builders to users.
Risk Factor: Valuation
Recent concerns over the pace and scale of building tech infrastructure—such as data centers and power generation—have raised comparisons to the telecom and internet buildout of the 1990s. The data and announced plans from the large players in the space, indicate continued growth and expansion. From an investment perspective, we see the buildout being just one phase in the overall development and utilization of the technology. From an economic and earnings perspective, users of the tech also stand to gain, and this is where we see a broad-based and long-lived opportunity.
Valuation metrics alone aren’t a reliable mechanism for identifying peaks in equity prices, though they merit significant attention—particularly when they are well above average, as in the case today. Furthermore, when valuations are elevated, the emergence of new risks or downside surprises in data releases can cause declines that are more rapid and severe than usual. This means that the current environment merits vigilance in the form of actively reviewing portfolio-level risk controls around asset allocation levels, attention to rebalancing decisions, estimating liquidity needs, and maintaining appropriate cash levels.
While valuations are rich—we peg them in the top 8% vs. history—they are nothing like 1999 and can be sustained if interest rates continue to decline. We characterize valuations at the upper reaches of normal, though not in the nosebleed territory from the 1990s.
Although the data is not perfect, we also examined the top holdings of mutual funds from 1999. Within the large-cap core universe, portfolio holdings in 1999 had an average profit margin of 10% Today, holdings of the same category of funds average a 20% profit margin. Today’s top companies have better fundamentals and are less expensive than their peers in the 1990s.
For some further historical context, consider the fact that enthusiasm over advances in technology drove the PE ratio on the S&P 500 from 17x at the start of 1995 to 30x at the equity market peak in 1999. To make a rough comparison to the current environment, we use the 17x PE ratio in the third quarter of 2022 as a possible starting point for the AI theme. In 2022, while inflation was a significant topic of discussion, much of the pandemic disruption had passed, and AI began to emerge as a more mainstream topic. Today, the same metric, trailing twelve-month PE, measures 25x, about three years into the journey.
From here, three paths can emerge:
- A stumble in fundamental data leading to a correction in prices.
- A modest advance, driven primarily by continued earnings expansion.
- A wave of enthusiasm, similar to the 1990s, is bringing equities to all-time peak valuation levels.
We deem the probabilities to be roughly 20%, 50%, 30%
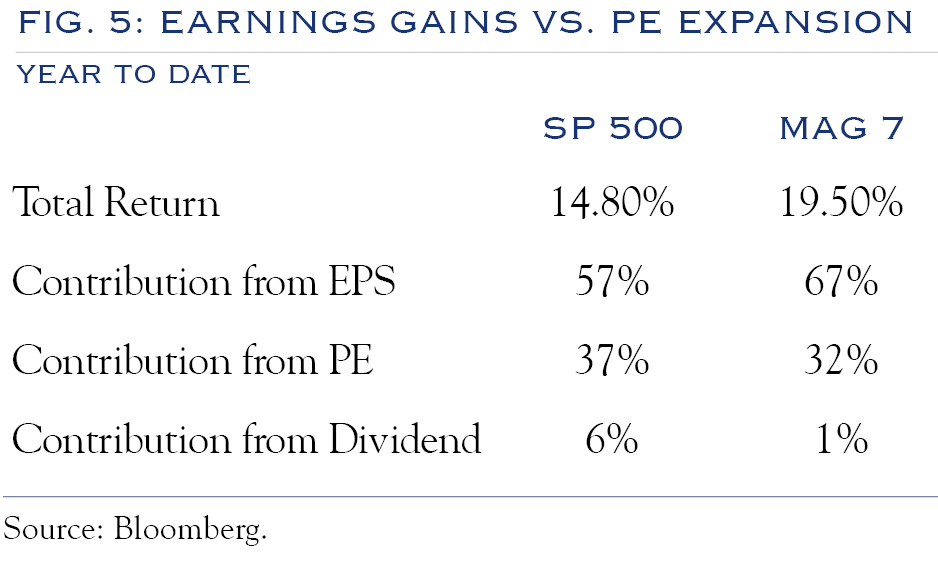
Figure 5 shows the proportion of gains coming from increases in earnings versus the expansion of the PE ratio. Earnings gains have mostly powered advances in stocks. We expect this trend to continue and remain sustainable, given what is likely to be an extended economic cycle (thanks to rate cuts) and continued expansion of profit margins (thanks to technological advances).
Global View: Fate of the Dollar
*Traveler’s note: Much of this research report was prepared while traversing small cities via short flights on small planes in the Eastern United States. Meanwhile, back home in New York City, the streets were jammed with the motorcades of global leaders converging on the United Nations
General Assembly.
Since its establishment in 1945, the UN’s primary purpose has been global peace, partly through the five permanent members of the Security Council. Of those five, two, the U.S. and China, stand out for their massive economies and innovation. The U.S. and China rank first and second in global GDP, at approximately $25 trillion and $15 trillion, respectively. Similarly, using patent rankings as a simple proxy for innovation, China ranks first globally, followed by the U.S. As an economic region, Europe ranks third in the world. In other words, the dynamics of geopolitics differ from those of global economics. However, in some circumstances, politics and economics collide. This was on vivid display during the early part of the year when U.S. equities and the U.S. Dollar suffered significant losses.
Although we interpret the move as mostly a one-off rapid rebalancing trade after several years of U.S. dominance in global capital flows, there are a few catalysts that cause fear over a longer-term slide in the dollar. Recent books such as “Our Dollar, Your Problem”(3) and “King Dollar”(4) raise some critical concerns. In order of seriousness:
- Deficit & Debt: A top concern is the emerging fear that fiscal policy will lead to continued deficit spending and debt accumulation.
While the scale of this problem has been expanding, we don’t see it as an immediate challenge to either the U.S. Dollar or the attractiveness of U.S. investments. On a relative basis, considering factors such as demographics, economic growth, and innovation, the U.S. remains capable of servicing its high debt load. There are levers to pull, such as reductions in entitlement spending, should politicians be forced to make difficult choices. - Rapid Policy Change: Recent rapid changes in U.S. policy are creating uncertainty. One example is the dynamic situation with tariffs.
A classic expression is that markets hate uncertainty. When policy has been uncertain, it is a logical reaction to avoid that uncertainty. We deem this risk to be primarily episodic. The initial shock of change from tariffs led to some global reallocation. Now this has generally subsided, apart from increased interest in hedging (not selling) dollar exposure. - Weaponization of the Dollar: Also on the minds of global allocators in recent years has been fear over a “weaponization” of the dollar, as outlined in “Paper Soldiers”(5).
Actions such as sanctions against Russia have raised concerns that the U.S. may employ similar policies against foreign adversaries. Though these actions have been targeted, global allocators may become concerned that sanctions could impair the value of U.S. holdings. We see this as a very narrow issue and not considered a threat for most users of the U.S. Dollar.
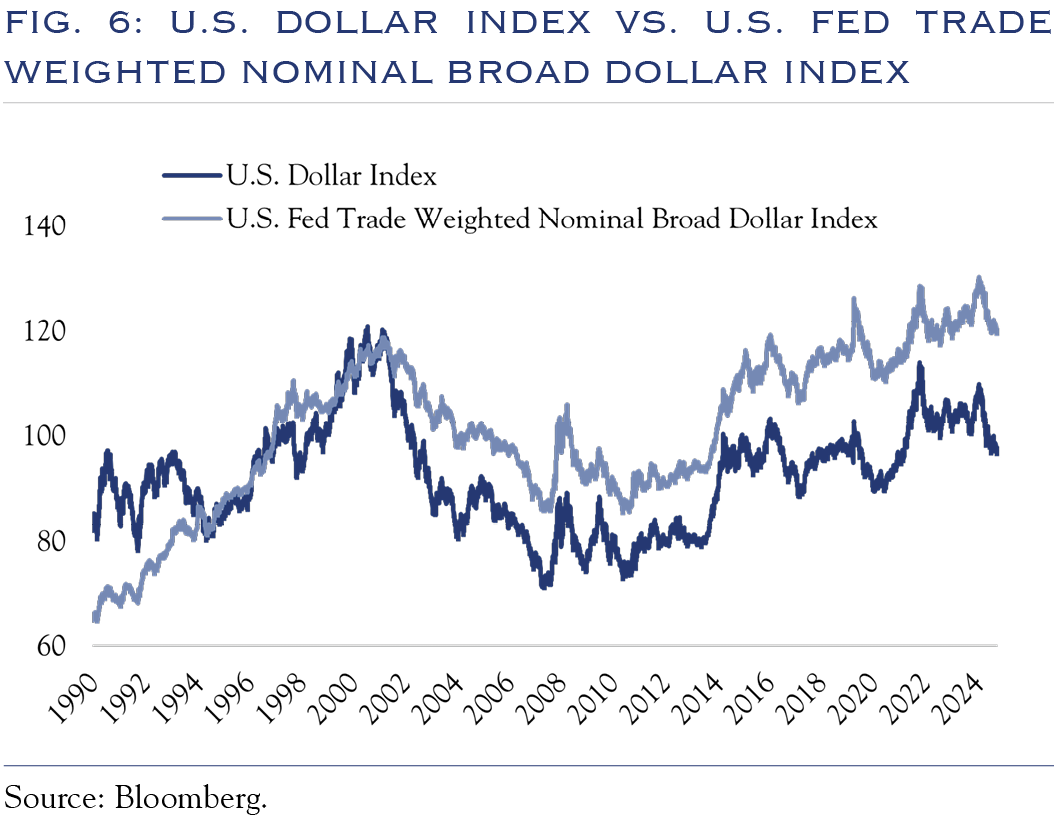
Overall, we observe a range of factors that could lead global allocators to gradually reduce their exposure to U.S. assets. This is somewhat deterred by the structural advantages in terms of ease of trade and dominance in transaction values, which make the U.S. Dollar a stable long-term store of value. Lastly, given that currency strength must be evaluated on a relative basis, we consider the largest currency markets listed below, and expect the combination of economic growth, innovation, earnings power, equity returns, and interest rate differentials to remain favorable, or at least neutral towards the U.S. As such, we don’t expect much further movement away from U.S. assets and look for the value of the U.S. Dollar to be mostly stable.
Top Ten Currencies: U.S. Dollar, Euro, Yen, Pound, Australian Dollar, Canadian Dollar, Swiss Franc, Chinese Yuan, Hong Kong Dollar, Singapore Dollar.
Outlook
With relatively clear visibility into a long runway of continued interest rate reductions, valuation-sensitive areas should continue to flourish.
Third-quarter earnings should provide some power as consensus expectations point to upper single-digit gains. Those gains are being fueled by economic expansion and ongoing productivity advances, which, in turn, boost profit margin growth despite the potentially regressive impact of tariffs.
For the quarter, technology and small-cap stocks are leading the way, and we anticipate this trend to continue through Q4—despite the outsized flow out of large-cap funds this past week. These two market segments—large cap growth and small cap—are nearly opposites. Large cap growth will continue to deliver as it is the area most equipped to boost productivity and control earnings. Meanwhile, the three necessary catalysts for continued small cap success are finally poised to fall into place.
One key small cap catalyst, the interest rate backdrop, is improving. Expectations for fed funds in June 2026 have evolved from 3.9% at the start of the year to 3.2% currently. A second catalyst, M&A activity, has begun to materialize in recent weeks. Lastly, we anticipate that small cap companies will begin to leverage AI in 2026 and find ways to boost their margins.
Small cap margins remain well off their average readings, while S&P 500 operating margins are comfortably above the pre-pandemic average and near 30-year highs. The pace of innovation is rapid, and we look for smaller companies to start catching up.
Stocks: Equities to follow earnings higher, and maintain a 5% overweight.
Market Cap: Small caps to continue to build on recent momentum, fueled by rate cuts and earnings.
Style: Maintain a balance of growth and value, deeming margin expansion a key element of success.
Geography: Select opportunities exist via compelling valuation differentials.
Credit: Careful security analysis is required to navigate tight spreads.
Rates: Look for rates to slowly edge lower.
(1) Erik Brynjolfsson, Danielle Li, and Lindsey R. Raymond, Generative AI at Work, NBER Working Paper No. 31161 (National Bureau of Economic Research, 2023).
(2) Morgan Stanley Counterpoint Global, AI Beneficiaries: Investing in Second-Order Effects (April 2025).
(3) Rogoff, Kenneth. Our Dollar, Your Problem: An Insider’s View of Seven Turbulent Decades of Global Finance, and the Road Ahead. MIT Press, 2023.
(4) Blustein, Paul. King Dollar: The Past and Future of the World’s Dominant Currency. Yale University Press, 2025.
(5) Mohsin, Saleha. Paper Soldiers: How the Weaponization of the Dollar Changed the World Order. Portfolio / Penguin, 2024.
This communication contains the personal opinions, as of the date set forth herein, about the securities, investments and/or economic subjects discussed by Mr. Teeter. No part of Mr. Teeter’s compensation was, is or will be related to any specific views contained in these materials. This communication is intended for information purposes only and does not recommend or solicit the purchase or sale of specific securities or investment services. Readers should not infer or assume that any securities, sectors or markets described were or will be profitable or are appropriate to meet the objectives, situation or needs of a particular individual or family, as the implementation of any financial strategy should only be made after consultation with your attorney, tax advisor and investment advisor. All material presented is compiled from sources believed to be reliable, but accuracy or completeness cannot be guaranteed.
© Silvercrest Asset Management Group LLC