For centuries, explorers relied on carefully drawn maps, coastlines inked in crisp lines, and borders marked with quiet confidence. The maps were helpful, but they were not perfect. As new expeditions pushed outward, they routinely discovered that the world did not always match the chart. There was always a gap between what was drawn and what actually existed.
Investment style classifications work in a similar way. Labels such as value, growth, and core offer a convenient asset allocation framework, but they are simplifications, not a full representation of what managers actually own. And like those early maps, the style map has shifted meaningfully in recent years, often without investors realizing it. This has made traditional labels less reliable when evaluating manager discipline or consistency.
There have been numerous industry commentaries noting that U.S. value and core managers appear more growth-oriented than they were before.
There have been numerous industry commentaries noting that U.S. value and core managers appear more growth-oriented than they were before. It is easy to assume this reflects performance chasing or style drift. But a closer look suggests that neither may necessarily be the case. Rather, it is the style landscape itself that has been moving.
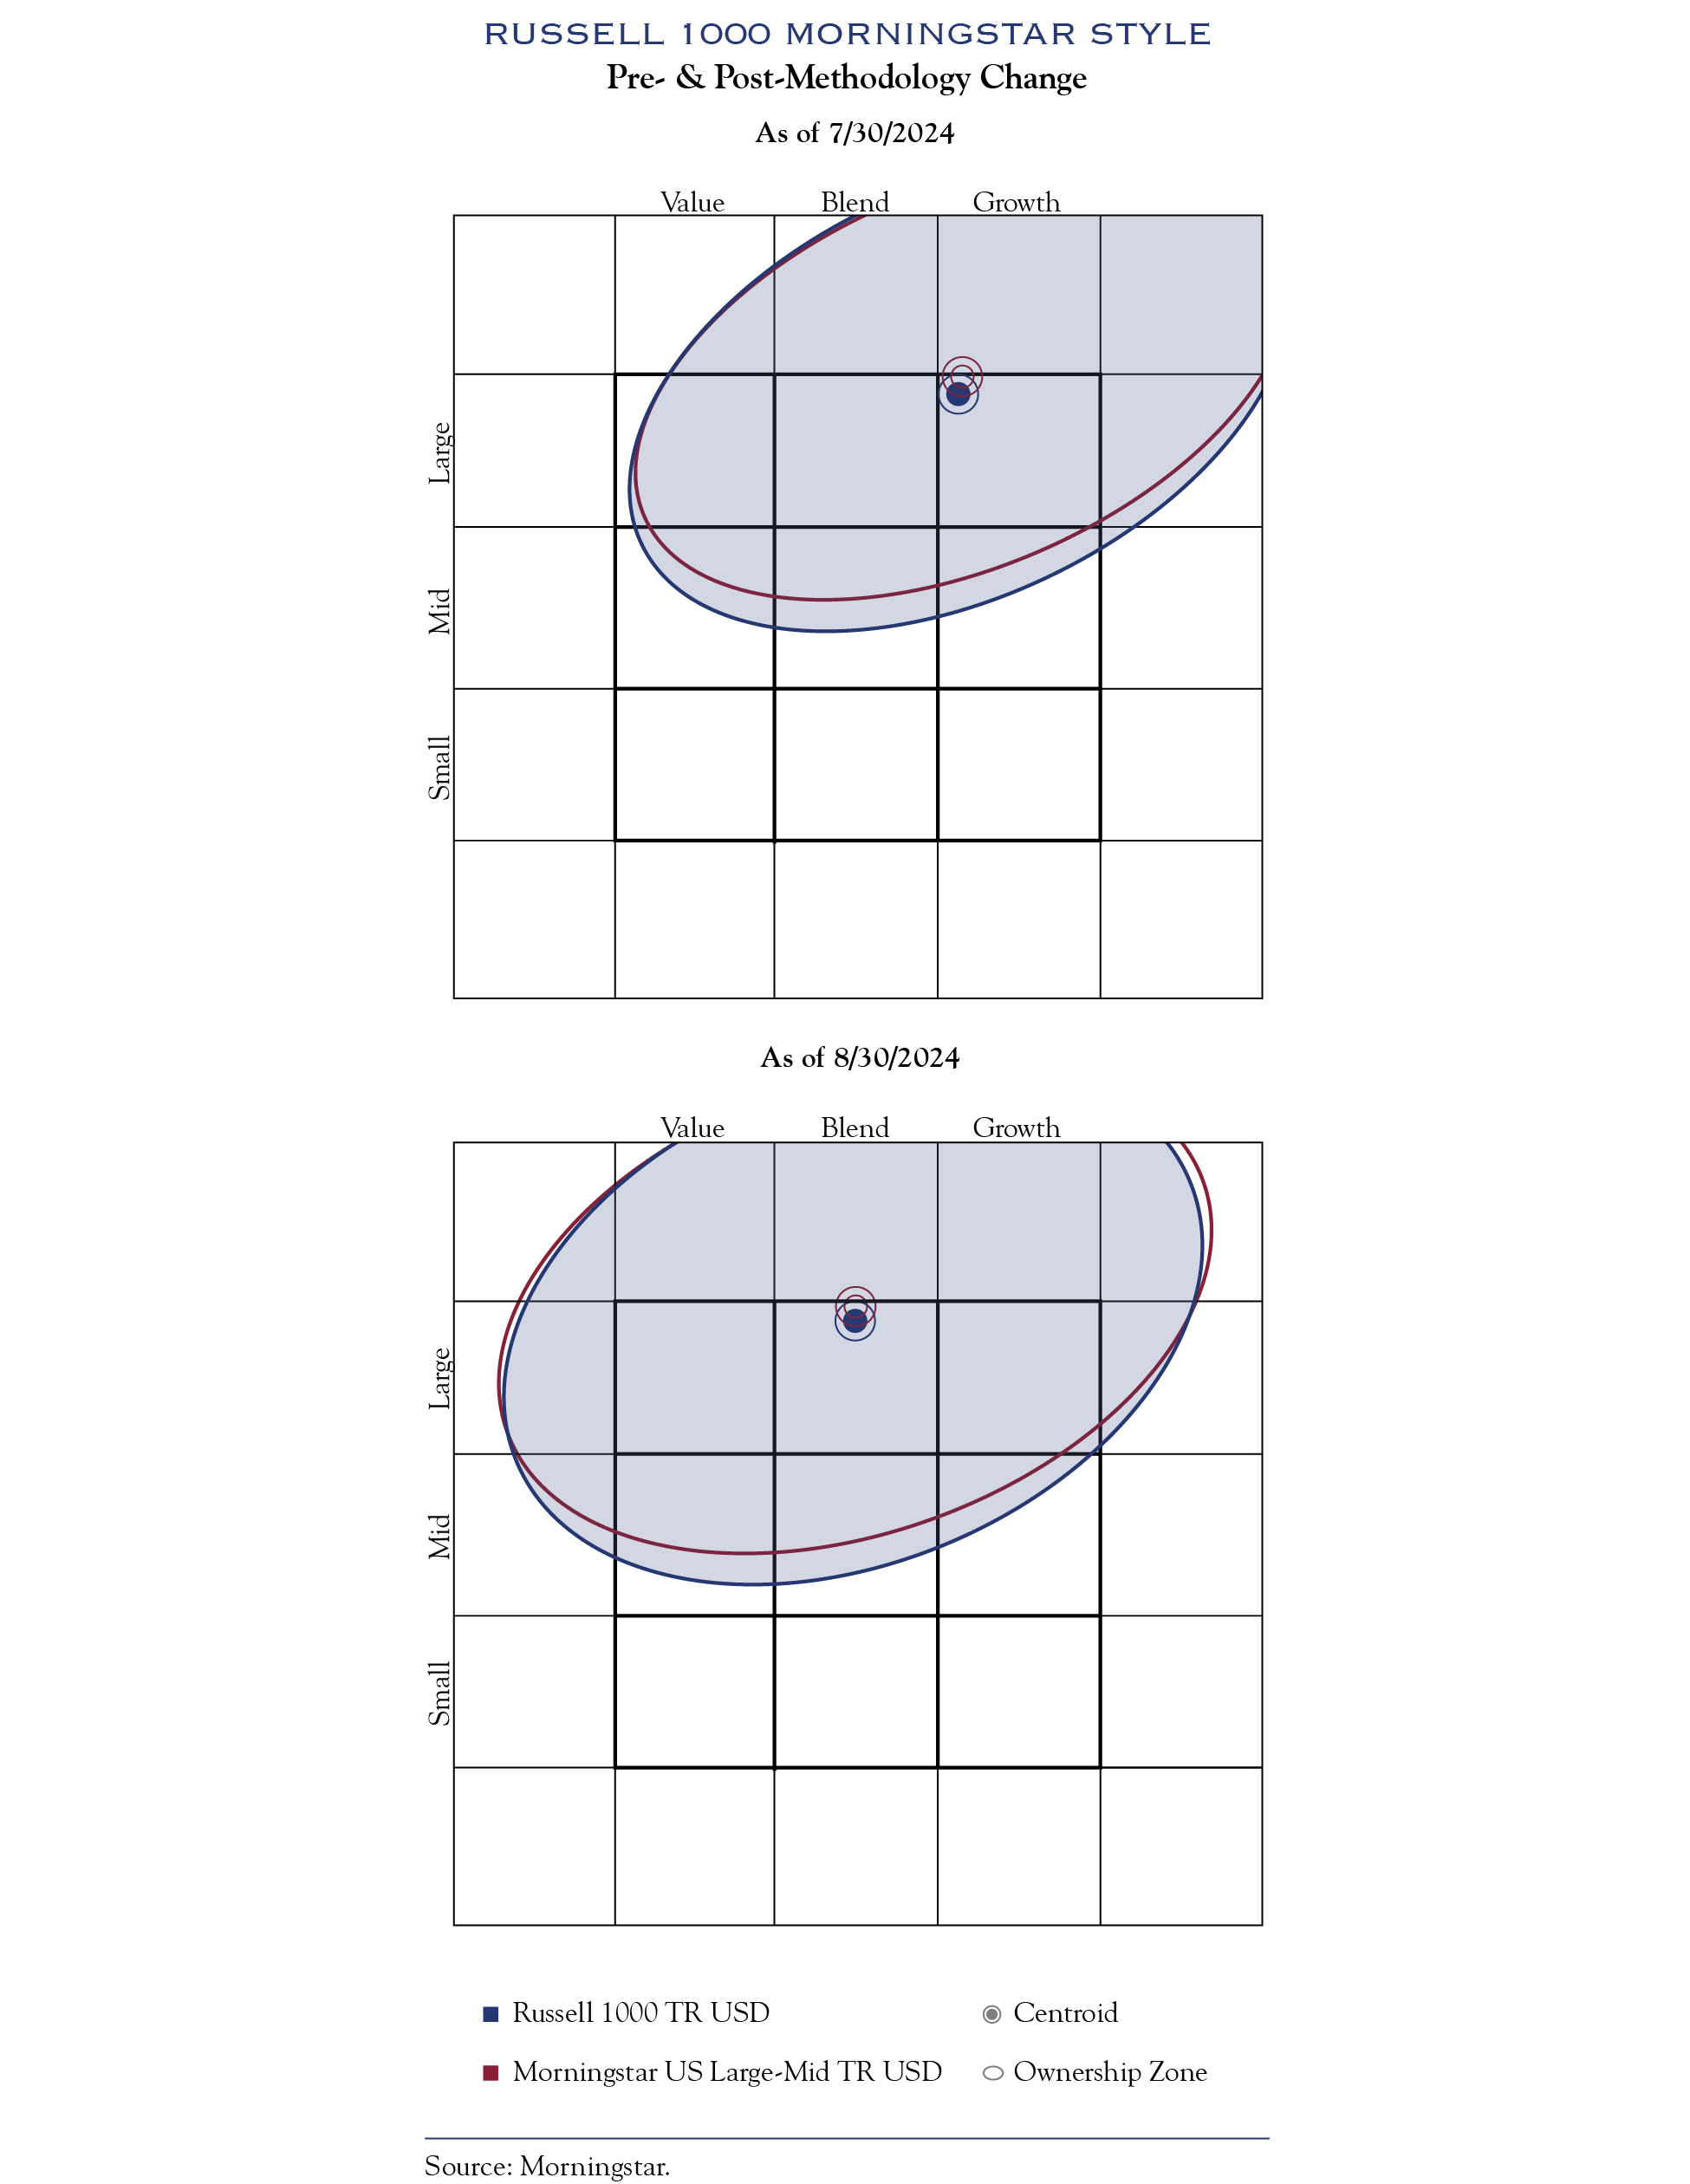
Morningstar’s style box is a widely used tool for allocators. In 2024, Morningstar found that the U.S. large-cap market had become so concentrated and dominated by companies with strong growth characteristics that nearly every portfolio in the group was drifting toward growth. Like any map, the style box requires updating. Morningstar recentered its methodology by adopting market-cap-weighted inputs so that each scoring group once again reflects a neutral midpoint. The intention was to ensure that the style box continues to describe the proper territory.
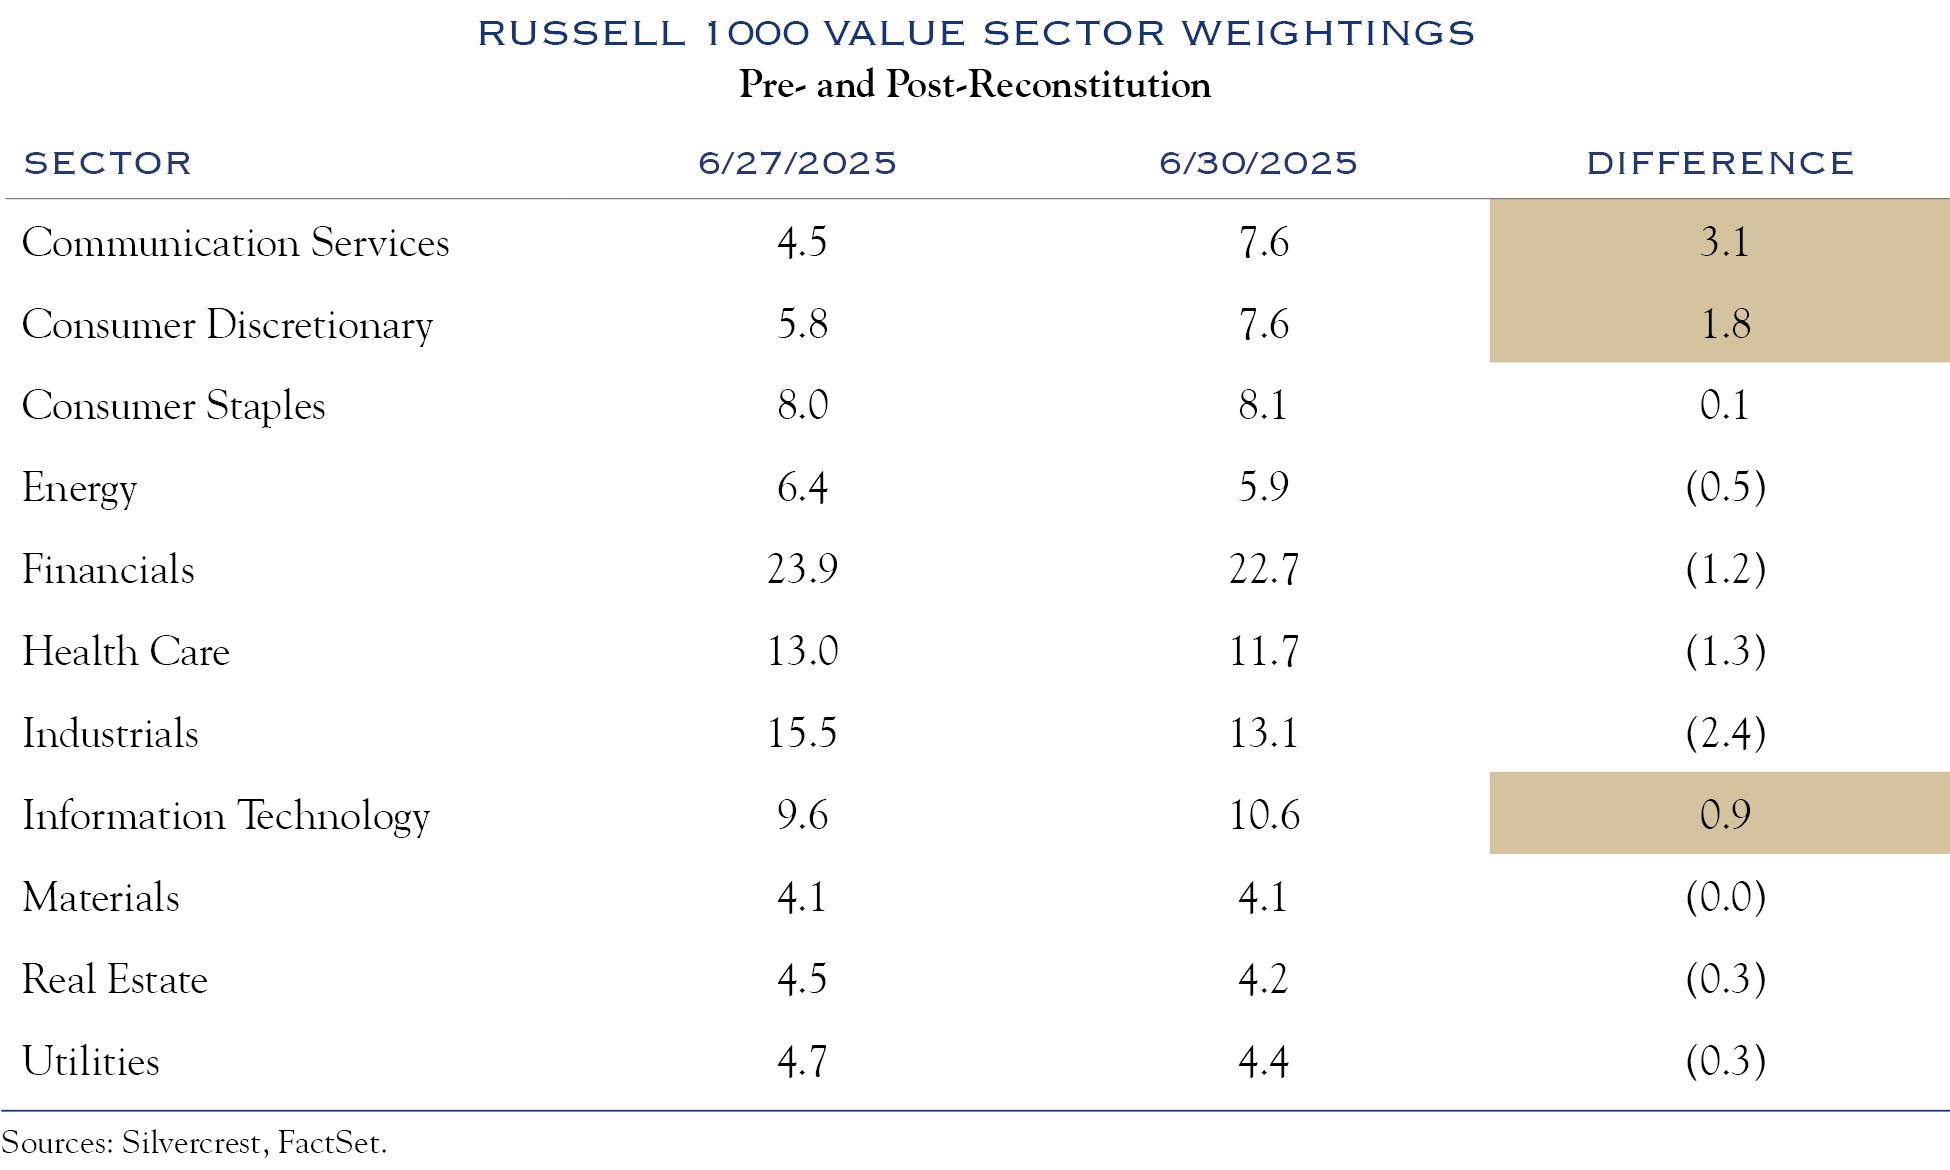
However, the underlying territory kept evolving. In the June 2025 Russell reconstitution, the Russell 1000 Value Index added portions of Amazon, Alphabet, and Meta. These companies, long associated with growth, together made up roughly 5.5% of the revised value index. Their inclusion shifted the style characteristics of the benchmark even though managers themselves may not have changed their portfolios at all.
At the company level, business models continue to evolve in ways that blur traditional style as well. Philip Morris International, for example, long seen as a defensive value name, increasingly exhibits growth-like characteristics due to its consistent cash generation, pricing power, and expanding reduced-risk products. Additionally, certain utility companies, historically viewed as stable and regulated value holdings, have become more prevalent in growth manager portfolios as they benefit from data center expansion and rising electricity demand driven by artificial intelligence. Their earnings profiles today reflect stronger secular growth than what is traditionally associated with the utility sector.
When the map is being redrawn, philosophy serves as the compass, and a consistent process enables a manager to follow that compass with clarity.
All of this market and business evolution reinforces why a manager’s investment philosophy and process remains the most stable reference point. Philosophy explains how a manager defines intrinsic value, what types of businesses they prefer, and how they behave during periods when markets strongly favor one style over another. It provides the context needed to distinguish true style drift from shifts that simply reflect changes in benchmarks or market dynamics. A consistent and well-defined investment process, in turn, ensures that philosophy is translated into decisions in a disciplined and repeatable way. When the map is being redrawn, philosophy serves as the compass, and a consistent process enables a manager to follow that compass with clarity.
As style boundaries continue to move, relying solely on labels becomes less effective. A deeper understanding comes from examining actual holdings and the philosophy and process that guide investment decisions. Maps can be useful, but real insight comes from a clear understanding of the territory.
This communication contains the personal opinions, as of the date set forth herein, about the securities, investments and/or economic subjects discussed by Ms. Ouyang. No part of Ms. Ouyang’s compensation was, is or will be related to any specific views contained in these materials. This communication is intended for information purposes only and does not recommend or solicit the purchase or sale of specific securities or investment services. Readers should not infer or assume that any securities, sectors or markets described were or will be profitable or are appropriate to meet the objectives, situation or needs of a particular individual or family, as the implementation of any financial strategy should only be made after consultation with your attorney, tax advisor and investment advisor. All material presented is compiled from sources believed to be reliable, but accuracy or completeness cannot be guaranteed. © Silvercrest Asset Management Group LLC