America 250
The National Park Service’s history of Independence Day reminds us that the first Independence Day carried a raft of conflicting emotions, noting, “Unfortunately, Americans were getting good and bad news at the same time. British troops were making landfall in New York as the Liberty Bell rang in Philadelphia.” John Adams wrote to his wife Abigail, speaking not only of the need for succeeding generations to commemorate the day, but also of the blood and toil required to maintain the Declaration. We all know the ending, but it is worth recalling the wide range of favorable and unfavorable events along the way. Markets today are offering up good and bad news; we sort through the implications below.
On the 250th anniversary of “The unanimous Declaration of the thirteen United States of America,” we offer thanks to all those who have contributed to the enduring success of the United States.
Summer at the Shore—Sharks & Red Flags?
As documented in the classic summer read, “Close to Shore,” a heat wave, the spread of polio, and a desire to step away from the news of an expanding World War I drove then-record crowds to the Jersey Shore. At the very spot where visitors were escaping their fears, a series of shark attacks created a panic “unrivaled in American history,” with closed beaches, steel nets, and shark hunts.
Unlike a black swan, which is an outlier defined by unpredictability, shark attacks occur with some regularity. What happened in the summer of 1916 caused a frenzy of fear, especially because it arrived in a setting of safety. For markets, which often swing from euphoria to panic, a shark attack could come in the form of a known risk that suddenly captures the public imagination.
Despite numerous macro challenges in recent years, technology stocks have continued to feel like a serene beach for investors. We expect increasing competition and dispersion to unfold within the AI theme. We also expect continued challenges from private credit, inflation, capital issuance, some complex deal-making, and valuation levels.
In an environment likely to see rapid change, we think it is wise to maintain a balanced risk profile and ample diversification. With elevated valuations for equities, it is also prudent to monitor the risks posed by current conditions. At the shore, this is done with beach warning flags.
Our View—Yellow Flag: The combination of strong fundamentals and elevated valuations is consistent with a yellow-flag situation. As an investment posture, this means emphasizing risk management and diversification. Specifically, our guidance is for portfolios to be positioned with a neutral posture relative to benchmark risk with ample diversification.
We encourage the identification and measurement of AI-related exposure, managed relative to benchmarks, with an intent to balance upside participation while avoiding excess concentration. This requires an understanding of the thematic commonalities that may not be apparent using traditional analysis. For example, if it trades like AI, treat it like AI. One AI-style technique we use to assess concentration risk is K-means analysis.
AI Everywhere & Competition is Growing
The AI theme has generated considerable enthusiasm among many companies and delivered significant, measurable gains in productivity, revenue growth, earnings growth, and economic growth. Simultaneously, equities have been on a narrow, intense run for much of the year, though gains have broadened in recent weeks. Interestingly, the former “champ” Mag7 Stocks are flat as a group for the year to date period.
Though AI is boosting productivity across a wide range of tasks, costs associated with token usage are coming into focus, raising questions about the full return on investment (ROI) of deploying AI. This has led to speculation that companies will reduce usage or move to lower-cost, open-source models.
Classic economic theory posits that more competition can lead to better consumer and user outcomes, though perhaps lower profits for some. In the case of the AI buildout, we continue to monitor three phases of the trend.
- Buildout of the computing capacity—chips, power, data centers, etc.
- Model creation—LLMs and other AI applications.
- Corporate usage—this will create dispersion.
Buildout Phase
The buildout phase has created many winners who are recipients of the capital expenditures required for computing capacity. In recent months, there has been some stock price rotation driven by perceptions of former, current, and future winners in this space.
Research from the Semiconductor Industry Association, drawing on a cross-section of AI models, estimates that semiconductors account for approximately half of the capex to build a new data center. The remaining components, in order of spend, are power & cooling, equipment excluding chips (racks, integration, etc.), and buildings/land. Without delving into the specs on GPUs, HBMs, etc., suffice it to say there is more than one way to build a data center. A more detailed take on those specs can be had by speaking with our experienced equity PMs and analysts.
Within the semiconductor space, stock prices have experienced significant volatility and rotation as analysts parse winners and losers while market share evolves and preferences (and cost management) shift in building out compute power.
Over time, preferences for the components of a data center buildout may change, as will the supply/demand and timeline dynamics. This creates a complex investing environment and our countermeasure for the complexity is to respond with simplicity—stay diversified and recognize that the rising tide is mostly lifting all boats, though to varying degrees. Consider that within just one component, semiconductors, the S&P 500 Industry group Semiconductors and Semiconductor equipment has posted a return of +43% YTD with a median return of +105%. (S5SSEQX Index MRR).
Model Creation & Competition
The website AIMultiple estimates the market share of LLM usage. Globally, the United States accounts for the largest share of LLM visits for consumer use. Focusing on API usage (developer/corporate), market share is evenly split between the U.S. and China. Among U.S. consumer usage, only two models have more than 20% share (ChatGPT and Gemini). For enterprise (corporate), there are providers with models that hold more than 20% market share (Anthropic, OpenAI, Google).
Recently, the cost of model usage has come into focus amid several high-profile corporate discussions about the cost-benefit trade-off for AI. The website benchlm.ai provides cost estimates across a range of models. The site lists pricing for 100 models with a range of costs and capabilities to suit every budget and need.
Model Usage Drives Dispersion
It’s easy to think through a typical corporate approach to using AI models. Initially, costs and usage were low for most models, and corporate messaging was likely to encourage usage. Now, with usage and costs increasing, the messaging has evolved to a more methodical evaluation of costs and benefits for the task at hand. This introduces significant complexity to the process of deploying AI in an enterprise.
Starting a new project? Should I use OpenAI GPT-5.5 Codex, or perhaps Claude Opus 4.8, or Gemini 3.1 Pro, or maybe Codex-Max? Wait, what about a lower cost approach like DeepSeek V4 Flash (Max)? This complexity is likely to have three profound implications.
1. It will constrain deployment for now, as cost-benefit has entered the equation.
2. It will drive massive dispersion across companies within industry groups as some firms figure it out fast/better/cheaper/more effectively than others.
3. Ultimately, like all competition, it will lead to lower costs and broader usage.
Economic & Earnings Implications of AI
Another complex dynamic is that AI is seen as a threat to certain recurring revenue models, such as software. At the same time, expenditures on the AI buildout are being treated, for now, as “locked in,” rather than a one-off, once-in-a-lifetime outlay.
Since the AI buildout is a catalyst for both the economy and markets, a critical question is: what does the AI backdrop mean for revenue, economic growth, earnings growth, and further stock price gains?
AI & The Economy
AI-related capex is currently forecast to grow rapidly and is large enough to noticeably influence economic growth. Our back-of-the-envelope approach (See exhibit below on GDP CaPEX) yields an estimate of ~1%, consistent with analysis from Paul Kedrosky and others.
The challenge is that these numbers must continue to expand to further increase the growth rate. Overall, we expect the AI buildout to be additive over the next few years, though we are on high alert for any sign of a slowdown in the growth rate as this would cause a major shift in investor mindset towards the segment.
AI & Earnings
The revenue and profit picture is clear, for now. Massive capital expenditures are driving huge revenue growth in industries related to the buildout. For example, revenue growth in the S&P Semiconductor & Semiconductor Industry Group has ramped up from 25% to a forecast of 65%. The exhibit below shows another indication of the reach of the AI buildout. The contribution to overall GDP growth of 2.6% includes a contribution of +0.6% from the private investment category—computers and peripheral equipment. While this category isn’t exclusively or perfectly linked to AI, it shows the power of the tech buildout relative to economic growth.
Despite all the good news, some challenges are emerging. In addition to evaluating whether the growth rate is increasing or decreasing and assessing timelines for the buildout, companies are beginning to evaluate the return on investment of their AI capacity spending. In other words, they are moving from a “build AI at all costs” mentality to a review of costs and benefits. On the cost side, anecdotal and transcript research shows an uptick in discussion of token costs. Among the components of the S&P 500, references to “token cost” increased from 0 in Q3 2025 to 17 in the current quarter and are likely to continue rising. In late January 2025, markets experienced a quick and sharp downdraft in response to the “DeepSeek moment,” whereby a cheaper approach to AI was yielding similar results to more expensive models. Much debate ensued, and questions of competitive espionage and copycatting emerged. Nonetheless, the march of technology nearly always brings increased competition and lower costs.
Our take is that this phenomenon is great for technology users, while the implications for tech builders are less clear as competition intensifies. We see a lot of media and market attention on the buildout of compute and models, and less on the use of AI to gain efficiencies and expand profit margins. Therein lies an opportunity, which is why we emphasize portfolio diversification, especially into firms managed by talented leaders who can drive process change to unlock the benefits of AI use. One outcome is that we expect market gains to broaden and become more dispersed rather than the concentrated gains of recent years.
AI & Stock Prices
The most challenging question is whether these gains in revenue and earnings will lead to further stock price appreciation. Most of the time, strong earnings gains will fuel stock price performance. However, ample gains have already flowed to AI’s perceived early winners. For the rally to continue, current winners must clear a much higher bar each quarter, or attention must shift to the next round of winners—users of the technology.
Another complicating factor for future equity gains is the increased issuance of equity via secondaries or IPO’s. Research from Goldman Sachs shows a major shift in trend: equity “supply” has been shrinking in recent years (mostly from buybacks) and is now neutral or potentially expanding, depending on the size and timing of upcoming Mega-IPOs.
Classic economic theory applies to the stock market—increased supply must be met with increased demand, otherwise prices will adjust (downward). For now, there seems to be ample enthusiasm to fuel demand for the AI buildout.
Macroeconomic Overview
The U.S. economic backdrop is solid, and a key driver of growth is the AI buildout. A dose of lower oil prices may help to further boost consumer activity.
In addition to the benefit to the economy from AI, the labor market remains steady, with increases in both payrolls and wages bolstering consumers’ spending. Stimulative tax policy with regard to capital expenditures is increasing corporate activity. Layered on top of that are wealth-effect gains from rising stock prices and a boost in spending power as oil prices decline.
Hiring remains sound, though the “no hire, no fire” trend seems to persist. One challenge could be that productivity is indeed rising in white-collar industries, while keeping a lid on hiring remains necessary even as demand for skilled labor in the AI and industrial buildout is high. Some companies are responding by funding training for skilled labor. Meta’s new “America’s Workforce Academy” is just one example of a company funding a training program to provide skills needed to participate in the buildout of AI and other infrastructure.
Although average hourly earnings are trending lower and inflation has ticked up, the combination of expanding payrolls (albeit slightly), rising wages, and an end in sight for higher oil prices puts the consumer in a solid spot.
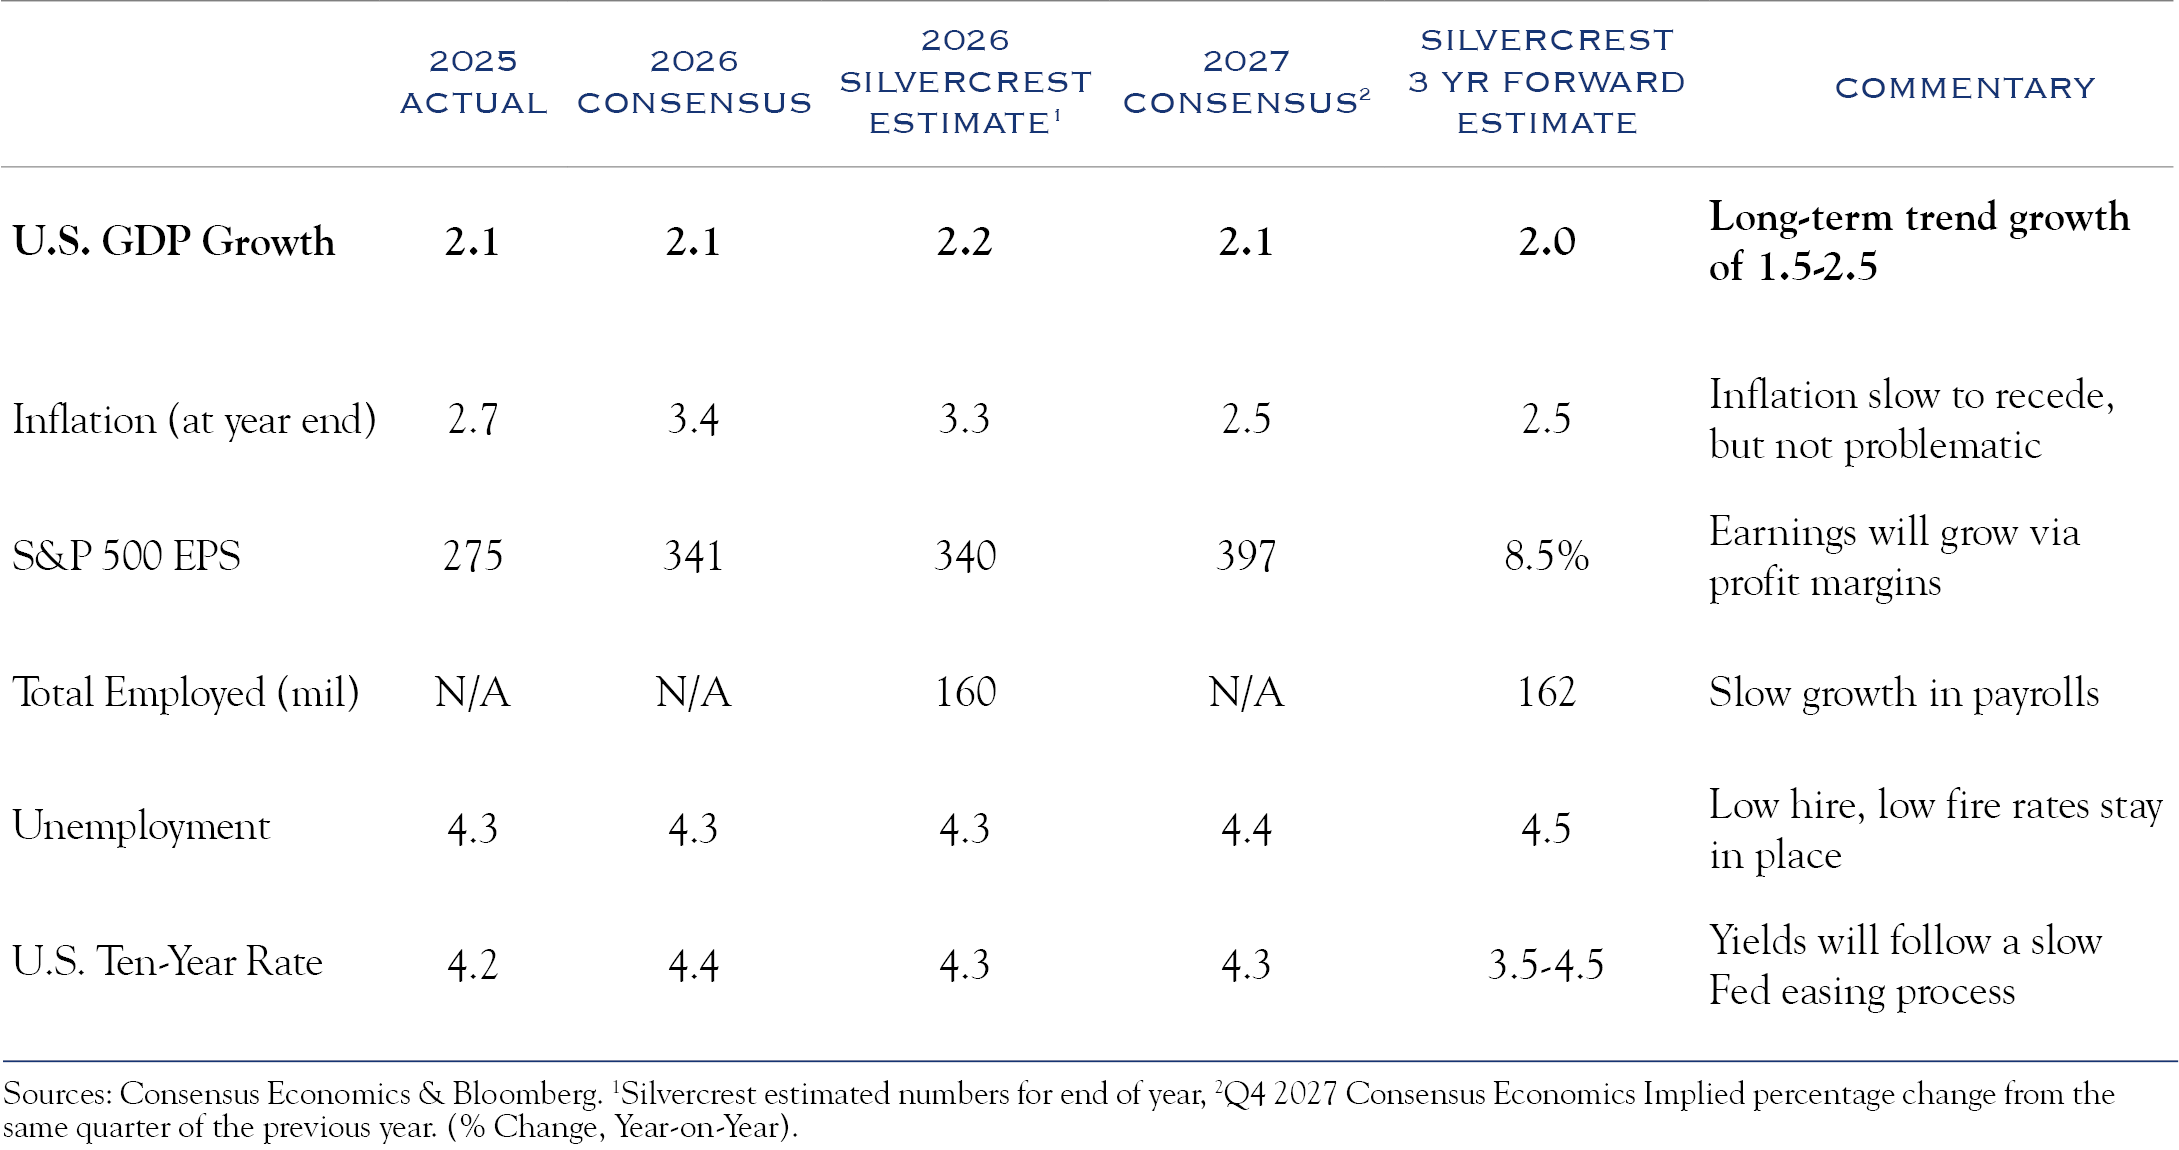
Overall, we expect economic growth to remain well above the 1.5% growth rate that has historically represented a stall speed for earnings growth.
Even so, we must acknowledge that any slowdown in the AI buildout could have negative implications on economic growth and perhaps the equity wealth effect.
Equity Overview
Consensus earnings estimates for the S&P 500 show expected growth above 10% for as far as the eye can see (next three years). Profit margins have been on the rise for years, constantly exceeding levels previously thought to represent a ceiling.
Over the past few years, we have held the view that stock price gains would need to come from strong earnings, as valuation levels were already fairly high. This year, that view has become much more mainstream.
We have also held the view that corporate dynamism is alive and well and expected companies to further boost profit margins and expand earnings at a rate well in excess of GDP. This, too, has become a more mainstream theme.
We continue to see earnings growth as the primary driver of equity gains—our model points to annualized returns of around 8% over the next three years. Our base case is for flat valuation metrics and growing earnings, though we plan to closely monitor whether positive earnings news provides enough fuel for further gains.
One risk is that earnings growth is being treated as a “given” in the equation. In recent quarters, there have been several notable instances of excellent earnings being met with flat or declining stock prices. This can be a signal that much of the good news is already priced in.
Rates
Shown below are expectations for Fed Funds derived from Bloomberg’s WIRP tool, pointing to a rate increase of 25bps later this year.
We expect the recent drop in oil prices will help alleviate some inflation pressure. However, underlying economic strength and inflation within the AI supply chain likely mean that the Fed will be on hold for some time. The labor market is likely to remain in a stable configuration without much heating or cooling.
The new Fed Chair, Kevin Warsh, is likely to gradually make some changes in Fed communication policy and perhaps increase the focus on the Fed’s balance sheet. While he has previously stated a desire for lower rates, he has more recently emphasized inflation. We expect no disruptive changes, only gradual evolution of policy and communication. As with most groups of people tuned into inflation and employment, the members of the Fed have a range of views regarding the current balancing act between battling inflation and supporting employment.
This mix of crosscurrents means, in our view, that there will be no changes in the Fed Funds Rate this year and that the yield on the U.S. Ten-Year Note will remain rangebound, no higher than 4.5%. That consistent, range-bound backdrop for rates will provide support for valuation at current levels.
Credit
We continue to recommend detailed security-level credit analysis as a mitigant to a pricey and complex credit market. Though spreads are tight, concerns have been growing around the potential implications of ongoing private credit redemptions. While the figures are large, they aren’t so big as to cause a market-wide credit problem. In fact, for now, given recent large new issuance, the fears seem to be fully contained within the private credit space. Even within private credit, we see a very wide range of quality in underwriting work and expect problems to be mostly idiosyncratic.
Outlook
Equity Level of Risk
We recommend an equity allocation that is neutral relative to long-term target exposure levels. For example, if target equity exposure is 60%, we recommend a 60% allocation—a neutral weighting. The long term earnings potential for equities is significant, though we deem the risk associated with above average valuation levels and the omnipresent influence of AI as reasons to avoid an overweight posture.
Equity Location of Risk
Equity Style
Industry standards for inclusion in “growth” and “value” indices have become convoluted in a way that makes the designations less meaningful in the current environment. We continue to recommend balanced exposure across the growth and value investments styles and believe that security selection will have a greater influence on results than style box designations.
Market Cap
Markets have begun to broaden, bringing smaller companies along for the rally. We think re-allocation/re-balancing, M&A activity and a more subdued backdrop in geopolitics and interest rates will allow the broadening to continue. Furthermore, as AI marches through the phases of building capacity, building models, and tech utilization, we see smaller company use of the tech as a driver of profit expansion.
Geography
We continue to advocate for global diversification. In addition to favorable valuation, wide range of economic conditions and sector differences bring diversification benefits. Lower weights in technology and higher weights in industrials and financials represent diversification relative to AI drivers.
Fixed Income
Rates
We see interest rates remaining rangebound and anchored to a Fed that will likely remain on pause. While inflation has ticked higher, a large portion has been a result of energy costs which are now declining. The AI buildout has also contributed to some inflation. Labor markets remain very steady, though payrolls and wages are not expanding at excessive rates. It is unlikely that the Fed would change policy immediately in front of the midterm elections. Unless either inflation accelerates from here, or labor deteriorates from here (both of which we deem low probability), we expect the Fed to remain on hold.
Credit
We continue to recommend very careful credit analysis on a security by security basis. Robust markets have perhaps glossed over some weaker situations. While we expect credit spreads to remain tight, individual security specific risks must be carefully monitored.
Introducing Global Insight
Reflecting the expanding global reach of our firm, we are debuting a new section—Global Insight—to cover pressing and prominent issues relating to global economic and market conditions. Our first note covers the deliberate march towards electrification in China. As reported by The Wall Street Journal, EV charging volume on highways surged 53% during the holiday period, according to data from China’s National Energy Administration. For this note, we are thankful for the research assistance from our long-time friend and China expert, Patrick Chovanec. We also draw on some “notes from the road” after having recently spent a week in China, covering four cities, an epic museum, and factory tours making electric vehicles, drones, and robots.
Global Technology Innovation—EV’s and Oil Usage
With a few hours between meetings in Chengdu and following a tip from a great friend and legendary investor based in Singapore, I booked a car for a day trip to the Sanxingdui museum. The museum is the site of ongoing excavation and currently houses 20,000 relics, many of which date to 1300 BC. The elaborate and clean designs showcase highly developed bronze casting techniques and point to a culture of innovation across millennia.
China, like the United States, remains an at-scale producer of innovation, with intense competition and progress in robotics, AI, and electric vehicles. The rapid development of the electric vehicle (EV) industry in China has had some wide-ranging macroeconomic implications. Among these are competition in the global automobile industry, capacity issues in the battery production supply chain, and, most recently, a major influence on oil demand during the conflict in the Strait of Hormuz.
One of the most visible features of China’s economy the past several years has been its “clean-tech” push. Hours of travel on highways in major Chinese cities yields an understanding of how dominant EV’s have become. Large commercial trucks that still run on internal combustion engines provide the only dose of noise and vibration familiar to travelers on highways in the United States. Much like General Motors which had “A car for every purse and purpose,” the EV lineup in China spans everything from cheap entry level, to higher performance cars with styling similar to iconic brands.
It’s not just about cars, but a massive build-out of capacity that has turned China into the dominant producer of clean-tech—prompting some to label it as the “Saudi Arabia” of renewable energy. The IEA says China’s share exceeds 80% across all stages of solar-panel manufacturing. China alone accounts for more than 80% of global solar module capacity and 95% of wafer capacity. China controls about 85% of battery cell output and 90% of raw-material processing for lithium-ion batteries; 92% of global battery anode material is produced in China. China’s dominance in wind is less pronounced: it “only” accounts for 60% of global wind turbine production capacity, compared with 19% in Europe and 9% in the U.S.
The motive behind this push lies in China’s need to overcome three separate but connected challenges.
- First, China must reduce its reliance on imported oil for future transportation and mobility, as these supplies are highly vulnerable to disruption due to war or crisis.
- Second, it must reduce its domestic reliance on coal for electricity generation, which not only severely impacts air quality but puts China at odds with global efforts to reduce carbon emissions.
- Third, the country must move up the value chain from “cheap manufacturing” to higher value-add technologies.
The result is not simply a response to market signals, but a coordinated, government-led effort to get ahead of the market. Government support is provided to boost consumer demand and support firms in favored “clean-tech” sectors up and down the supply chain. All this has enabled companies in heavily capital-intensive industries to build up factories, tooling, supplier networks, and working capital, while surviving years of losses before scale advantages appear.
On the consumption side, the results haven’t made China “energy independent”, nor has it freed China from coal or imported oil. But it has hedged China’s vulnerabilities. In 2024, China imported about 11.1 million barrels per day of crude oil. The IEA 2026 outlook says EVs reduced China’s oil demand by around 1 mb/d in 2025, about 15% below what road-transport oil demand would have been without EVs. Together with judicious stockpiling of seven months of oil imports as strategic reserves, this newfound flexibility was able to take the edge off the price shock when Iran recently closed the Strait of Hormuz. Nor is instability in the Middle East China’s only concern, oil is a vital lifeline and China will continue to work to insulate the economy accordingly.
Electrical power for EVs still must be generated, and that is where broader changes to China’s grid come into play. The majority of China’s electricity still comes from fossil fuels, namely coal, but that number is falling, because most of the country’s new capacity, to facilitate growth, is coming from renewables. According to the EIA, China added 356 GW of non-hydro renewable capacity in 2024. To put that in perspective, that expanded generating capacity is roughly 29% of the entire U.S. installed generating capacity of every type—coal, gas, nuclear, hydro, wind, solar. This expansion of renewables met 84% of China’s electricity-demand growth in 2024.
China has placed big bets on dominating chosen technologies that it thinks will define the future—but the future is notoriously fickle. In the early 1980s, many in the U.S. feared that Japan had seized the crucial high ground through state-directed investments in mainframe supercomputers. Then along came U.S. tech innovation and an entirely different vision of the future based on personal, portable, and networked computing. Driven by disruptive entrepreneurs, the U.S. leapt ahead.
China’s clean-tech “revolution” is being fueled by a development model that is uniquely Chinese. This comes with a cost. Many of China’s clean-tech players dominate their global industries, by offering the lowest prices, and operating at a chronic loss—even before government subsidies are calculated in. And those losses are getting worse, not better: the IEA notes Chinese solar PV prices are down more than 60% since 2023, with major manufacturers far from any immediate prospect of making a profit. The ability to create non-market incentives that ignore profits and losses can fuel rapid growth, but can also create a future reckoning.
There are significant differences in the drivers of Chinese and U.S. growth and innovation. While China carries a state-supported advantage in investment and scale, the U.S. model brings the flexibility and adaptability of financing which is mostly provided from the private sector. As the two largest economies in the world, understanding these differences of approach creates opportunities and risks across the dimensions of geopolitical power, economic growth, corporate profitability, and investment outlook.
This communication contains the personal opinions, as of the date set forth herein, about the securities, investments and/or economic subjects discussed by Mr. Teeter. No part of Mr. Teeter’s compensation was, is or will be related to any specific views contained in these materials. This communication is intended for information purposes only and does not recommend or solicit the purchase or sale of specific securities or investment services. Readers should not infer or assume that any securities, sectors or markets described were or will be profitable or are appropriate to meet the objectives, situation or needs of a particular individual or family, as the implementation of any financial strategy should only be made after consultation with your attorney, tax advisor and investment advisor. All material presented is compiled from sources believed to be reliable, but accuracy or completeness cannot be guaranteed.
© Silvercrest Asset Management Group LLC