
Introduction
The past 15 years have been rewarding for equity investors, despite the setbacks of the pandemic and inflation, both of which were, in hindsight, relatively brief. Looking to 2026 and beyond, we see a similar pairing of the opportunity for capital appreciation alongside volatility. A few significant themes are emerging, all centered on AI. The years ahead will be complex and compelling, and they will require a calculating approach.
The complexity arises from recent scrutiny of opaque lending practices, conflicting signals from the labor market and consumers, as well as an extremely narrow set of stock market leaders. Yet it is a compelling backdrop as the U.S. economy remains in expansion mode and advances in technology are allowing profit margins to expand to historic levels, thereby powering strong earnings gains. The combination requires that portfolios be constructed in a calculating manner, with careful attention paid to risk levels and factor exposures.
Author’s Note: America 250
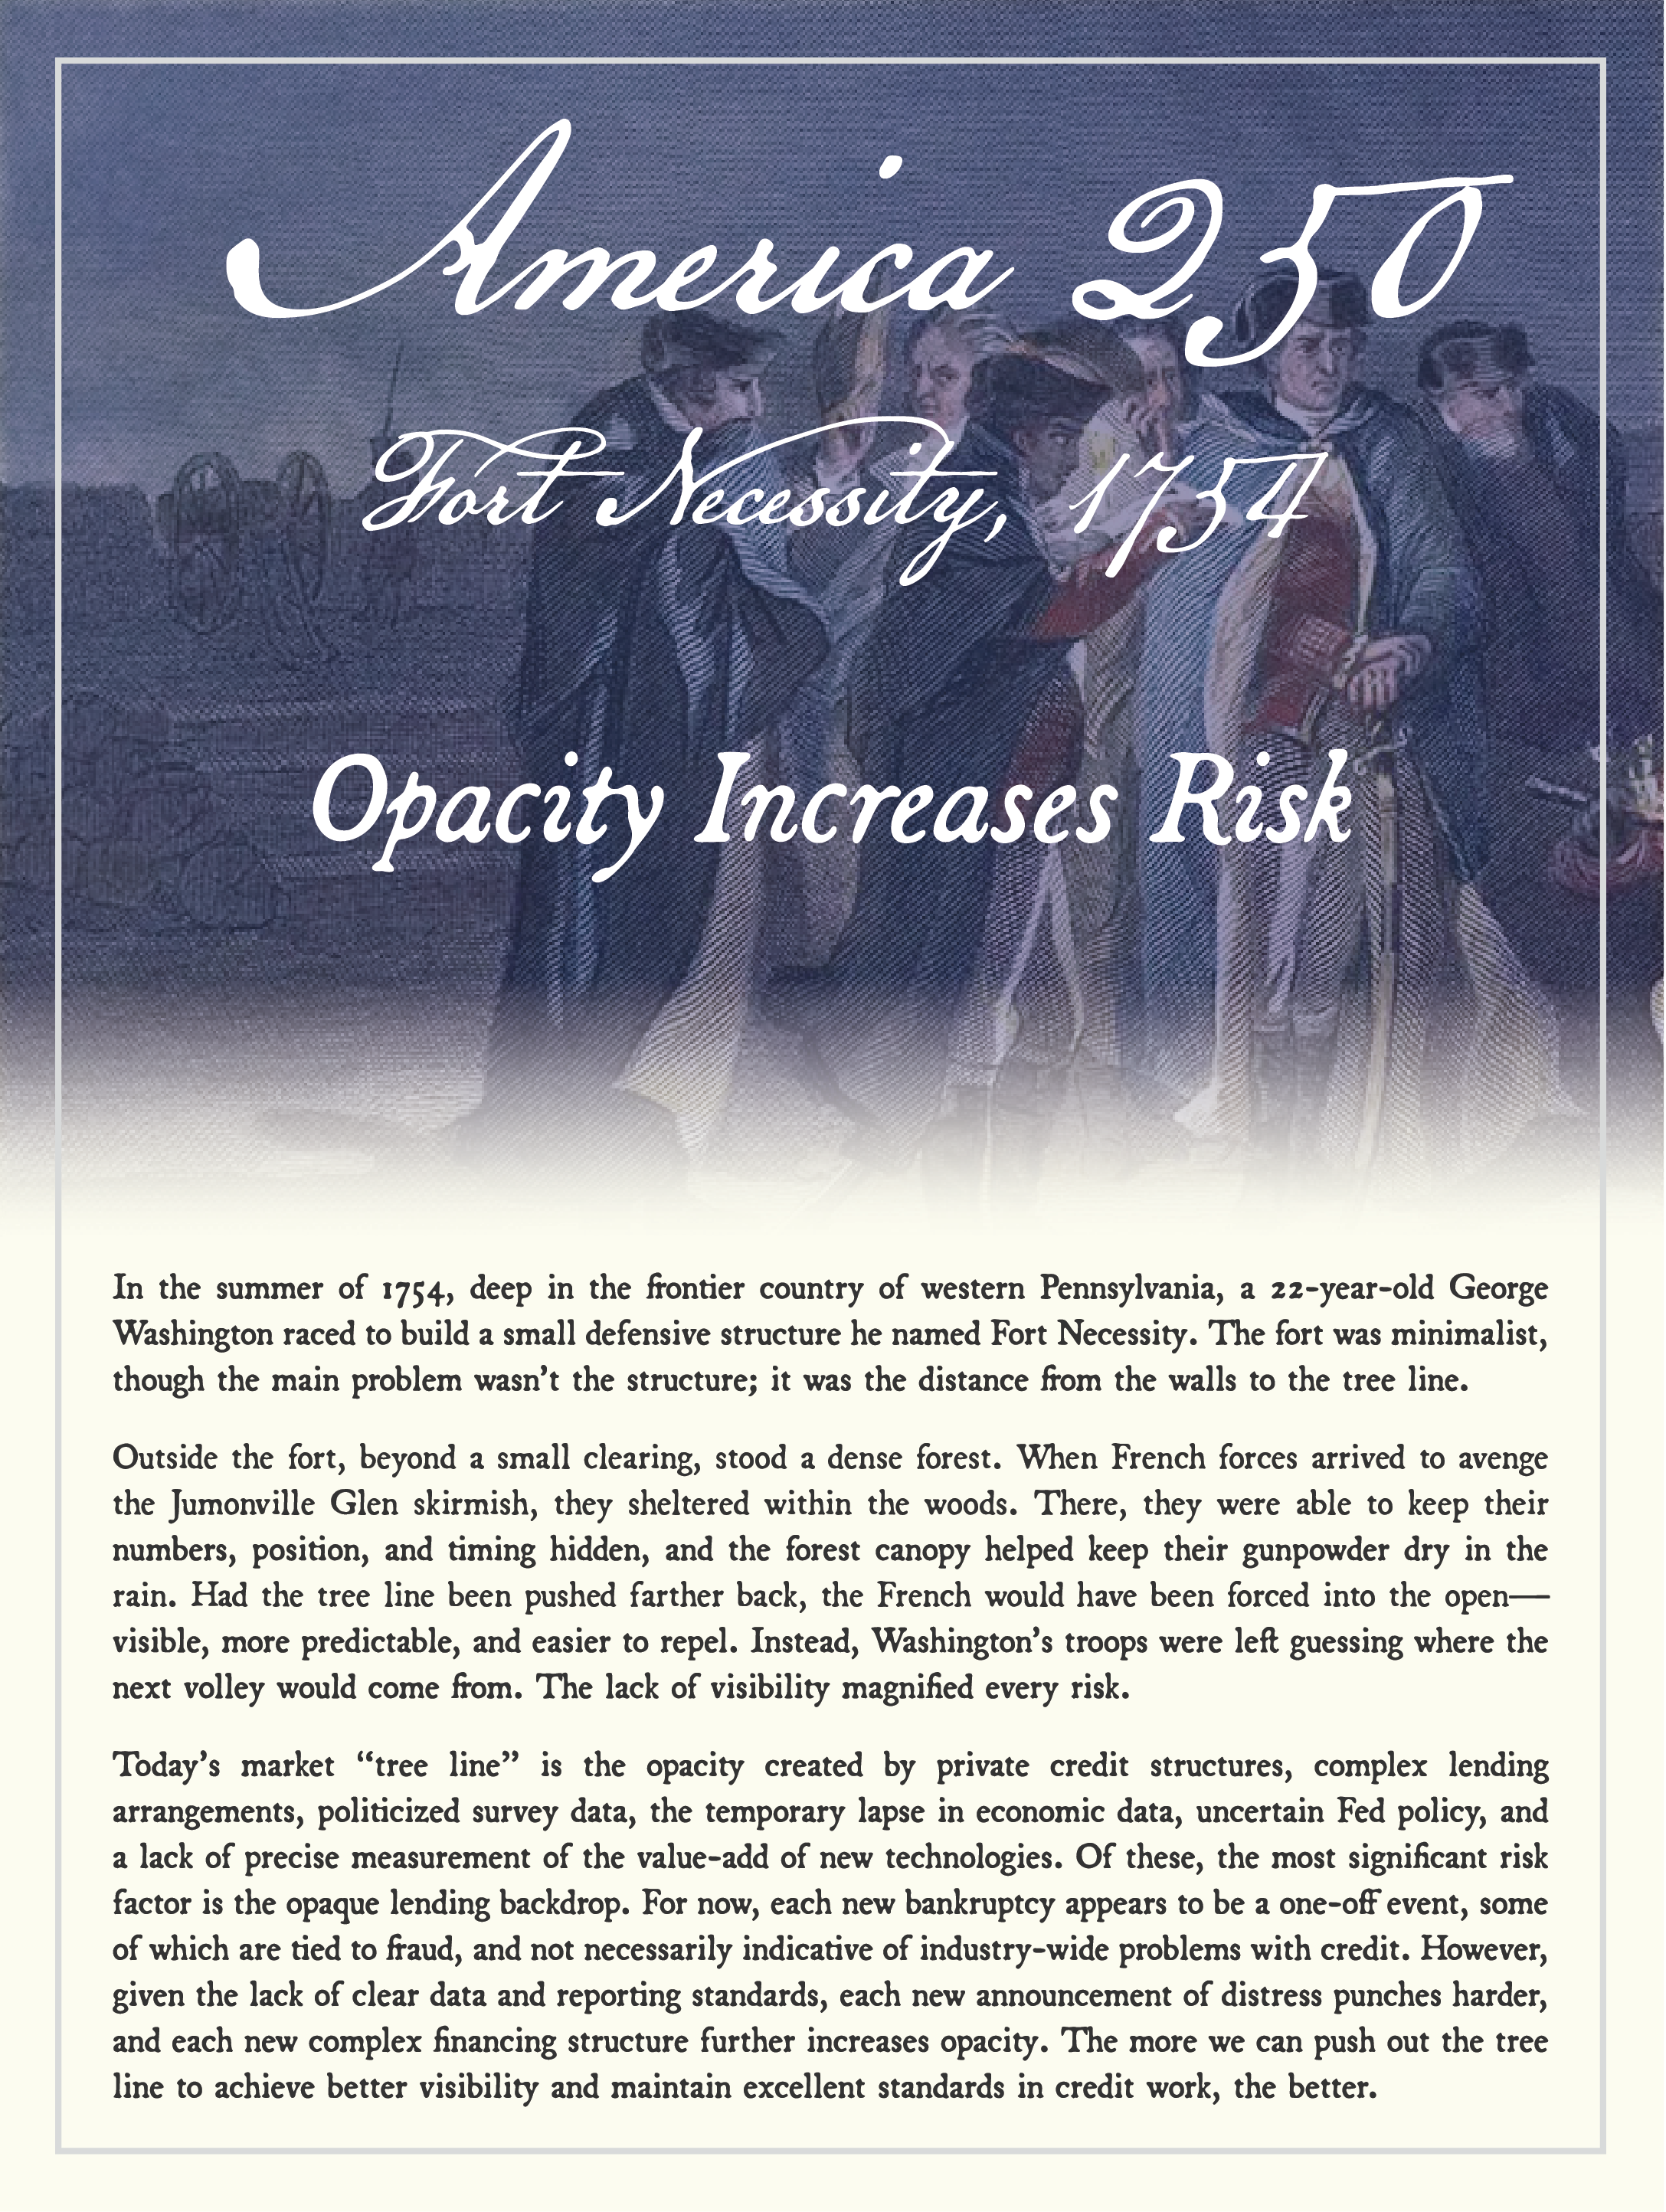
Significant segments of early American history unfolded near our office in New York City and my hometown in western Pennsylvania. For our 2026 outlook, in honor of America’s 250th anniversary, we draw on three stories from the 1700s to illustrate enduring concepts relevant to the current investment landscape. The first story highlights the risk of not having clear visibility, the second stresses the importance of staying the course when times get tough, and the third demonstrates the value added from having a disciplined process.
The Economy
After a long stretch of compelling data, the economic forecast has shifted from clear to partly cloudy. On the negative side, tariff friction, the partial government shutdown, DOGE layoffs, and policy uncertainty all exert a drag on growth. At the same time, tax incentives and a business-friendly regulatory backdrop are producing growth. Further complicating matters is the continued uncertainty surrounding a breakeven rate of payroll expansion, given the changing metrics related to immigration/population growth, as well as the disparate set of circumstances facing consumers across economic strata. All of this contributes to a very messy economic data backdrop.
The foundation of our economic growth forecast is built on three key elements: models; labor, hires, and wages; and real-time data.

Models
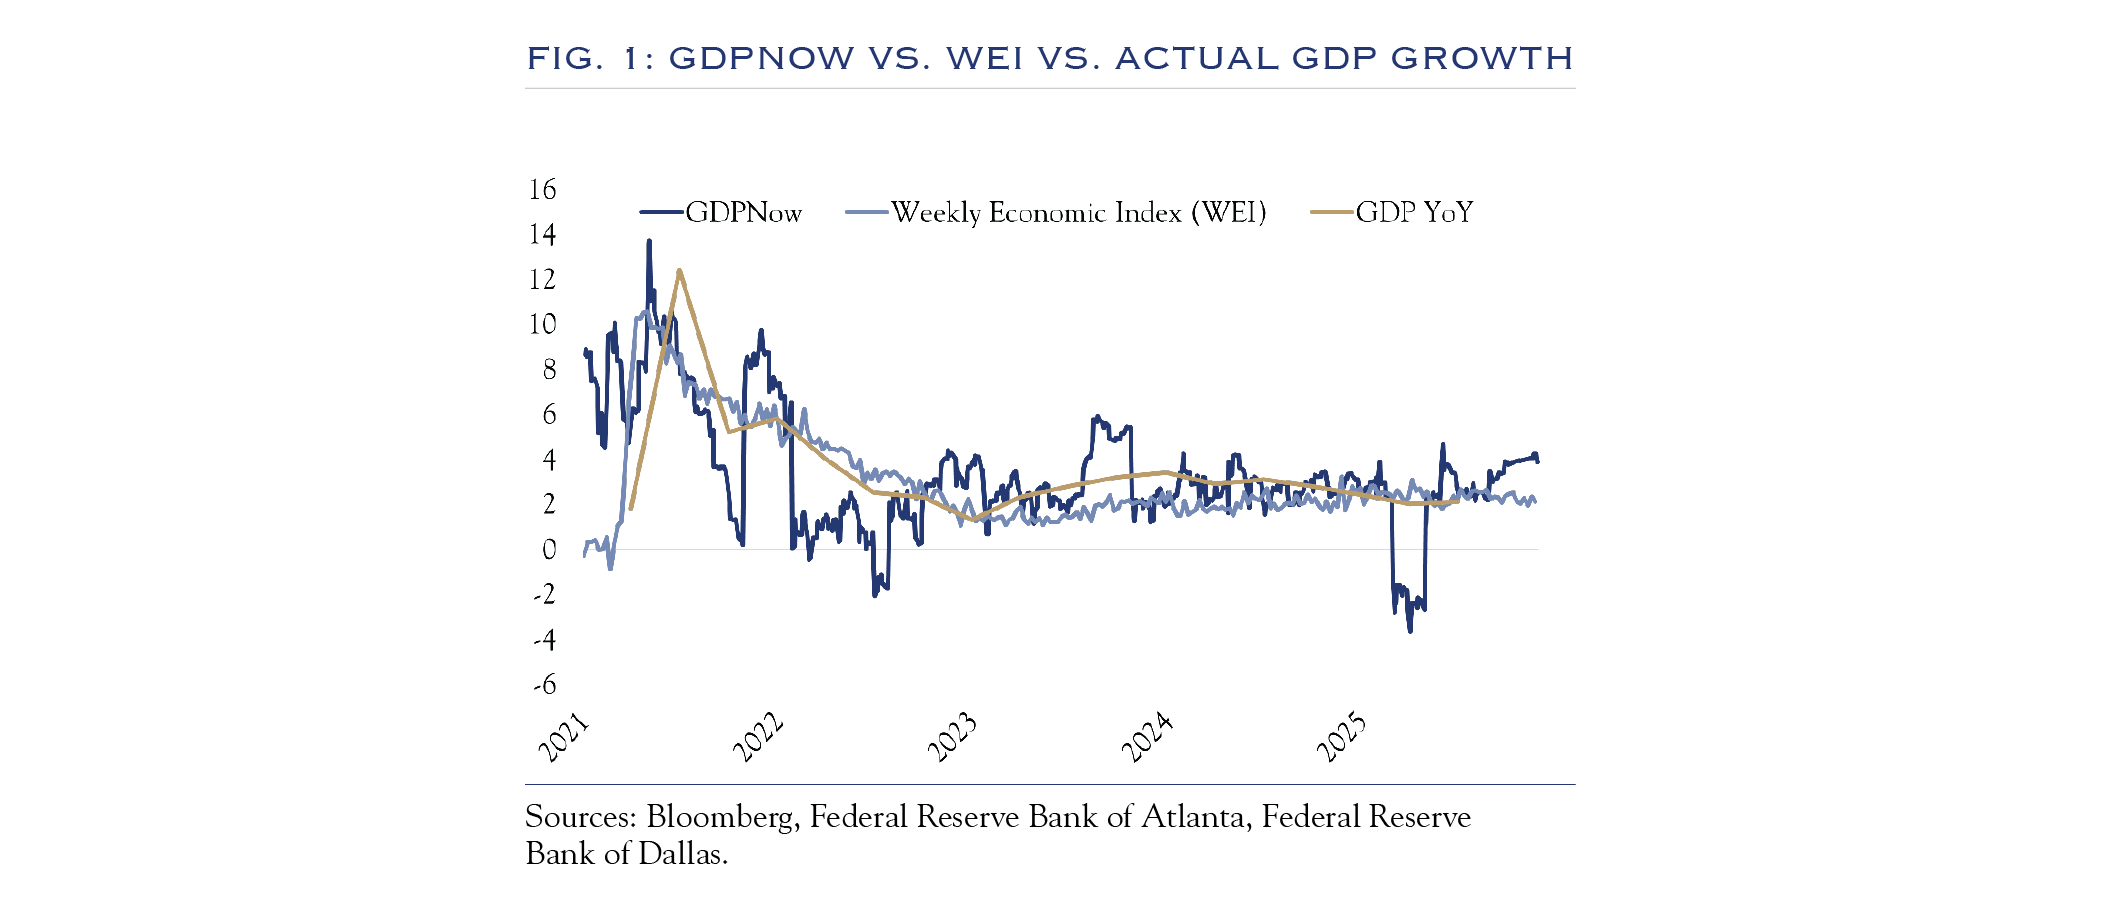
Headline figures and underlying data from prominent economic forecast models provide a big-picture view of the general growth backdrop. Figure 1 shows the Atlanta Fed’s GDPNow, Dallas Fed’s Weekly Economic Index (WEI), and actual GDP growth. The three series track closely to one another, demonstrating that both GDPNow and WEI are reliable real-time estimates of GDP. It is also notable that the GDPNow metric is more volatile than WEI. Beyond the models, the full scope of data we review aligns more closely with the WEI estimate of modest economic expansion.
Labor Market
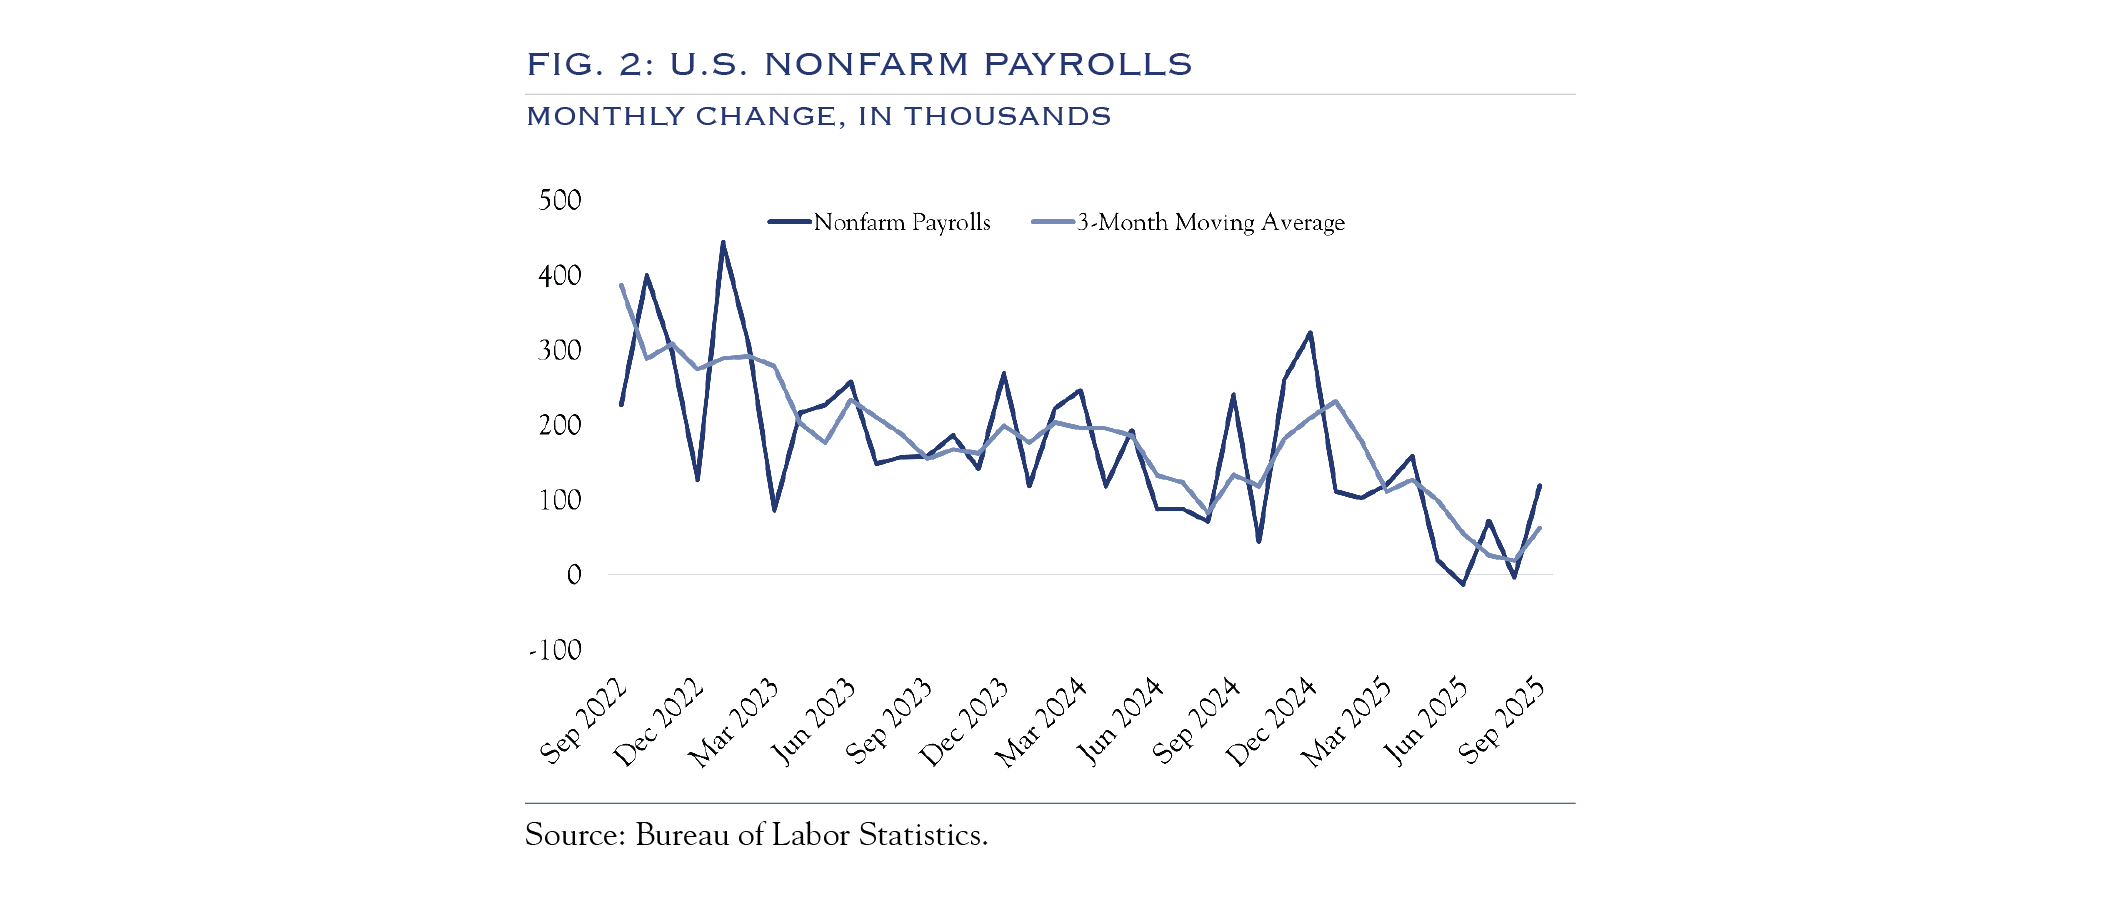
The foundation for the consumer economy is the job market. While some labor market data have been interrupted by the government shutdown, it appears that hiring has continued at a modest rate while layoffs have not accelerated (Figure 2). In contrast with prior hiring slowdowns, the pullback doesn’t seem to be in anticipation of a recession. Recent high-profile layoffs at some large companies have been described as “right-sizing.” Similarly, slower hiring practices seem to be directed at doing more with less and leaning on AI to boost productivity. Walmart has discussed maintaining a flat headcount despite growing revenue. On the BG2 podcast, Microsoft CEO Satya Nadella discussed growth in headcount as something that would occur with a lot more leverage (efficiency leverage, not financial leverage). Walmart CEO Doug McMillon said, “It’s very clear that AI is going to change literally every job.” Another clue that AI is influencing hiring practices is the rising unemployment rate for younger hires with bachelor’s degrees. While still low, it has been rising for the past three years (coincident with the rise in AI). A recent story on Bloomberg noted that college graduates now account for 25% of the total unemployment.
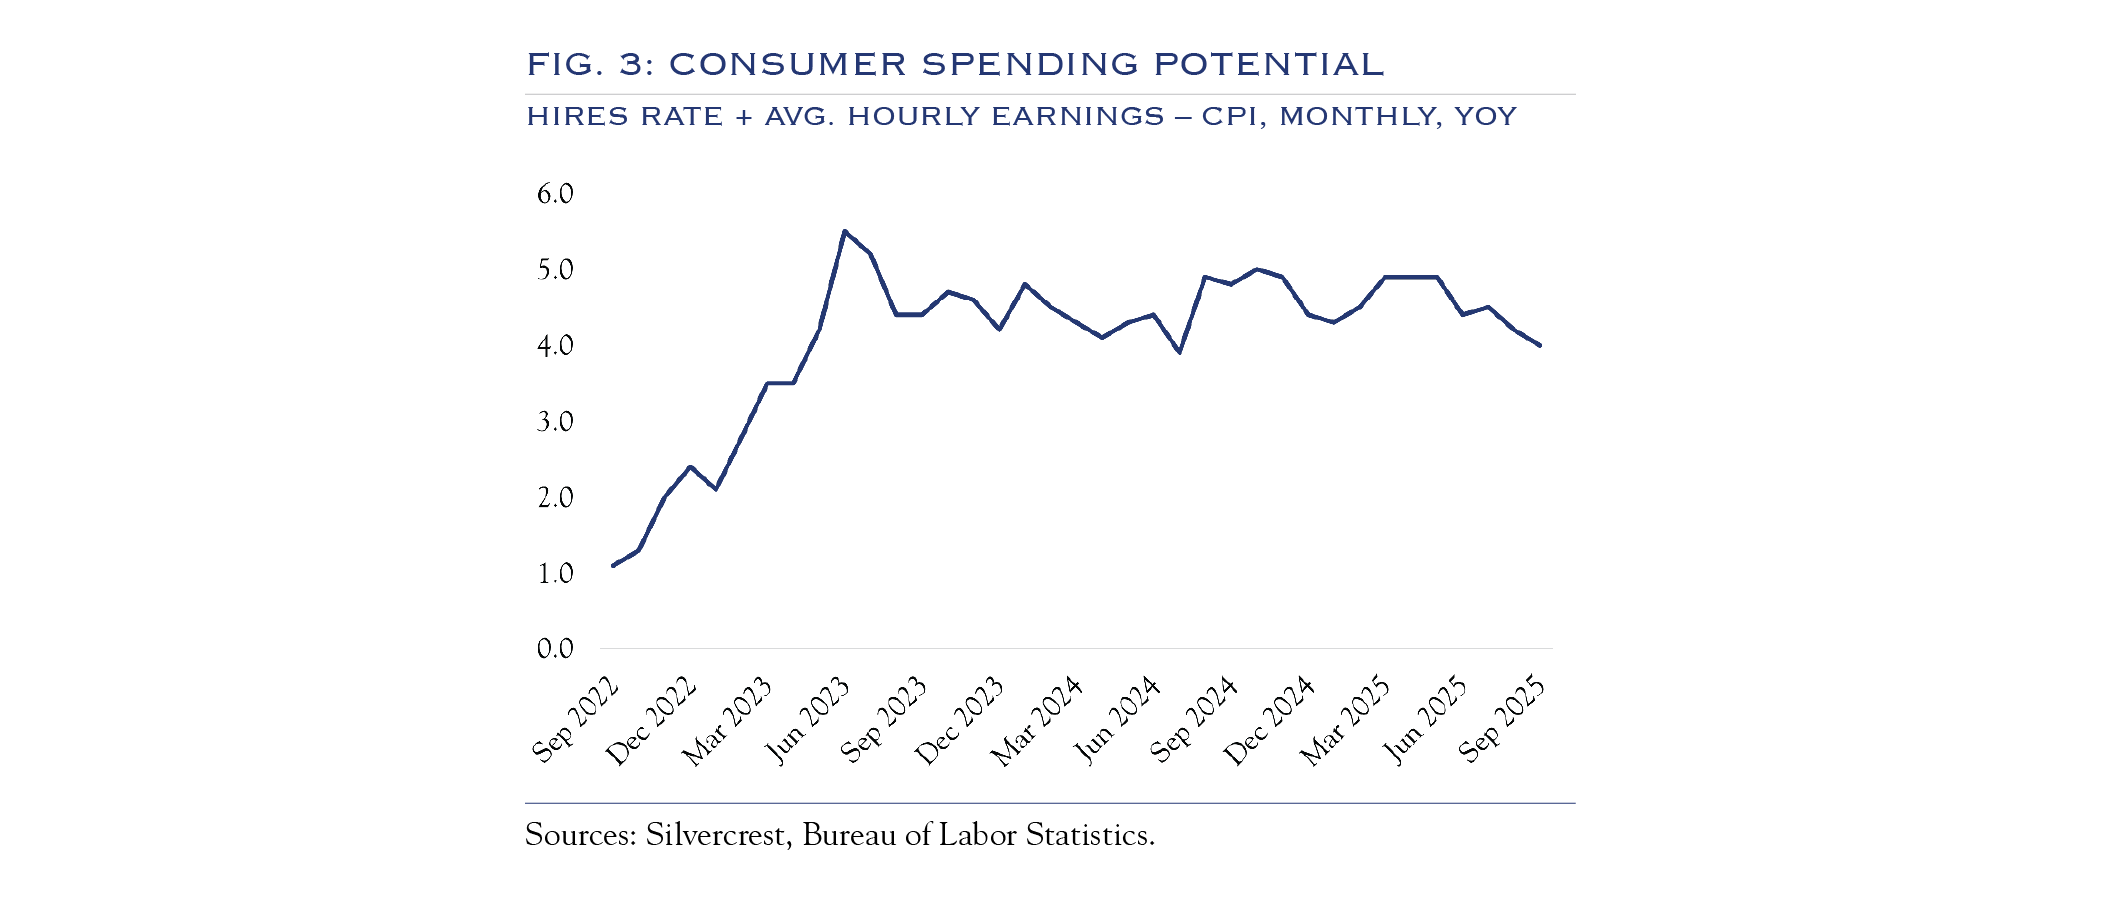
In Figure 3, we update our simple model for assessing spending potential by combining the rate of payroll expansion, change in wages, and inflation. Taken together, this creates an estimate of the potential to spend for the U.S. consumer. As shown, consumers have an additional 4% of spending potential compared to the prior year.
Another way of describing the current drivers of economic growth comes from Gregory Daco, Chief Economist at EY Parthenon and President of the National Association of Business Economics (NABE), who says the economy is running on “Three A’s”: affluent consumers, AI enthusiasm, and asset price gains. Since those three elements are tightly linked, broader-based job and wage gains would bring some additional support to the economy. Conversely, an equity market decline could create a drag on economic growth.
Consumer Spending
Consumer spending has remained mostly steady across a wide range of sources, including bank card data, Bloomberg Second Measure, Johnson Redbook, and revenue figures for Consumer Discretionary companies.
Bloomberg Second Measure (Figure 4) is a real-time dataset on consumer spending from a broad range of underlying providers. It shows a slowing rate of consumer spending to a near-flat level. That is in contrast to bank card data, which show a higher rate of spending growth. The difference is that the bank card data typically skew to a higher-end consumer. In recent years, higher-end consumers have benefited from the wealth effect of rising markets, whereas lower-end consumers typically have not.
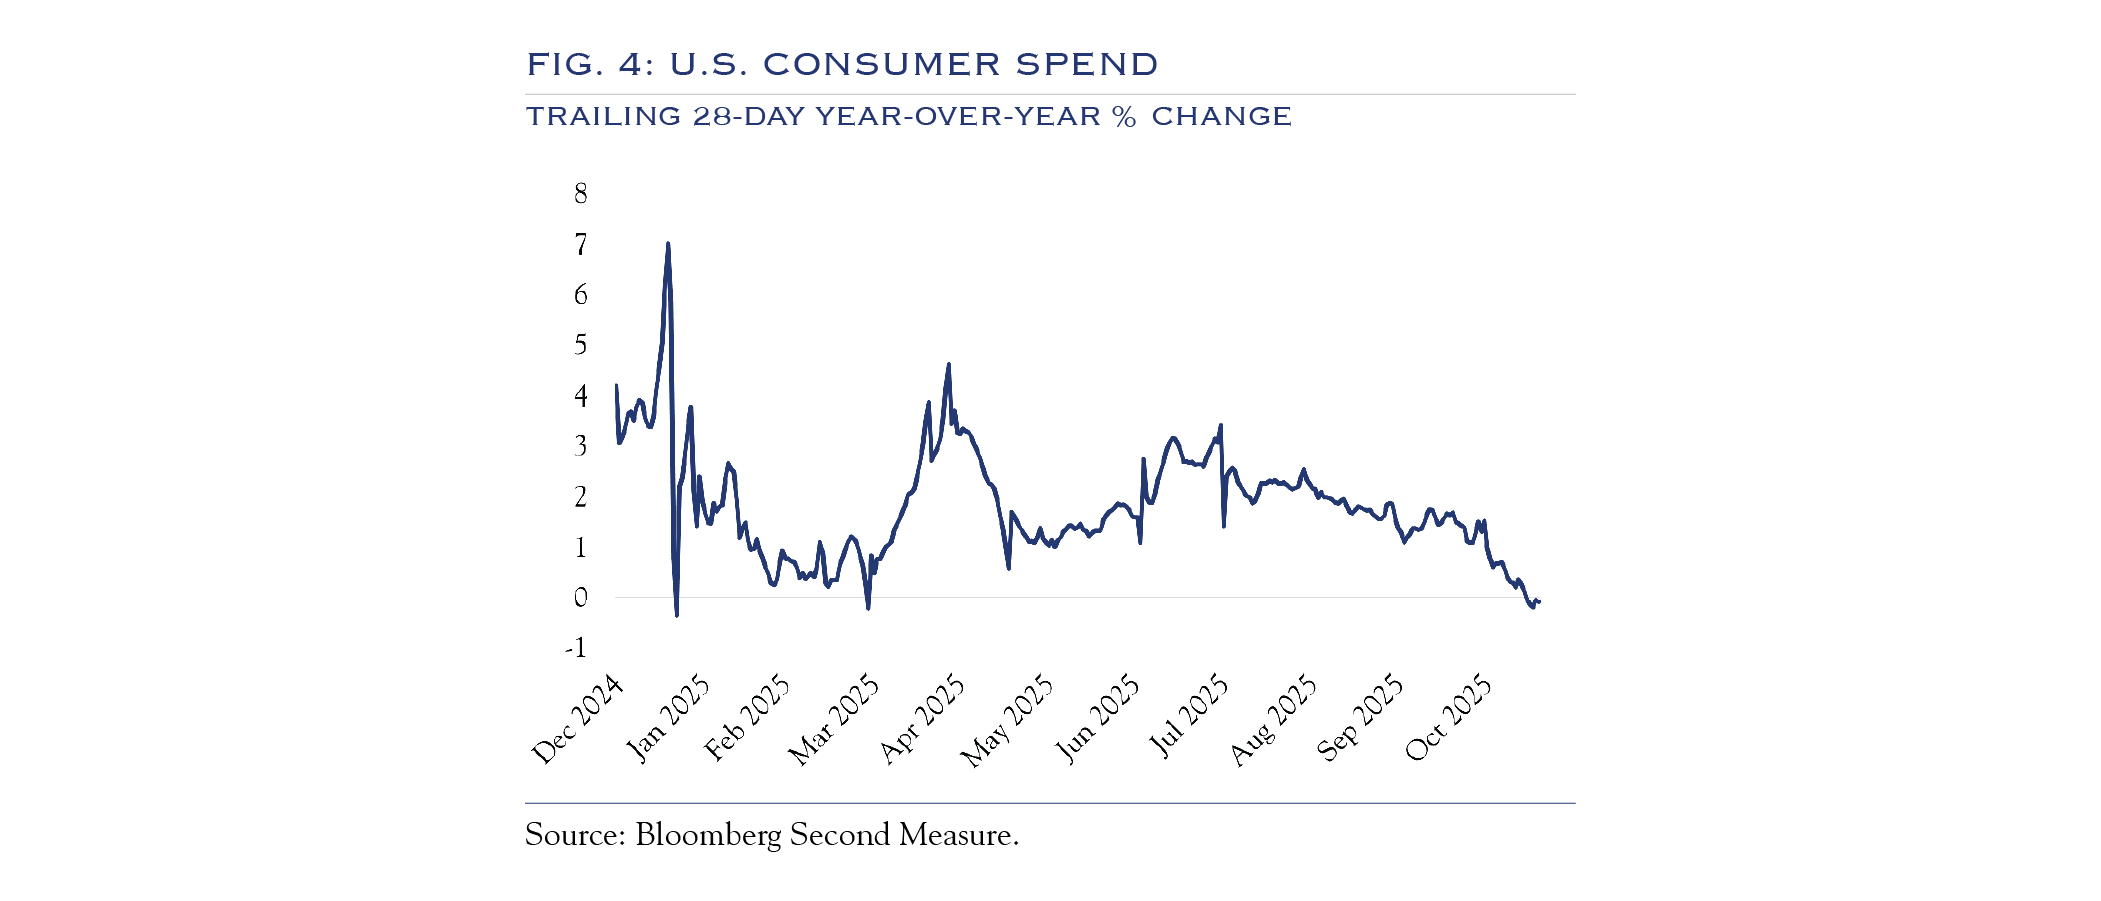
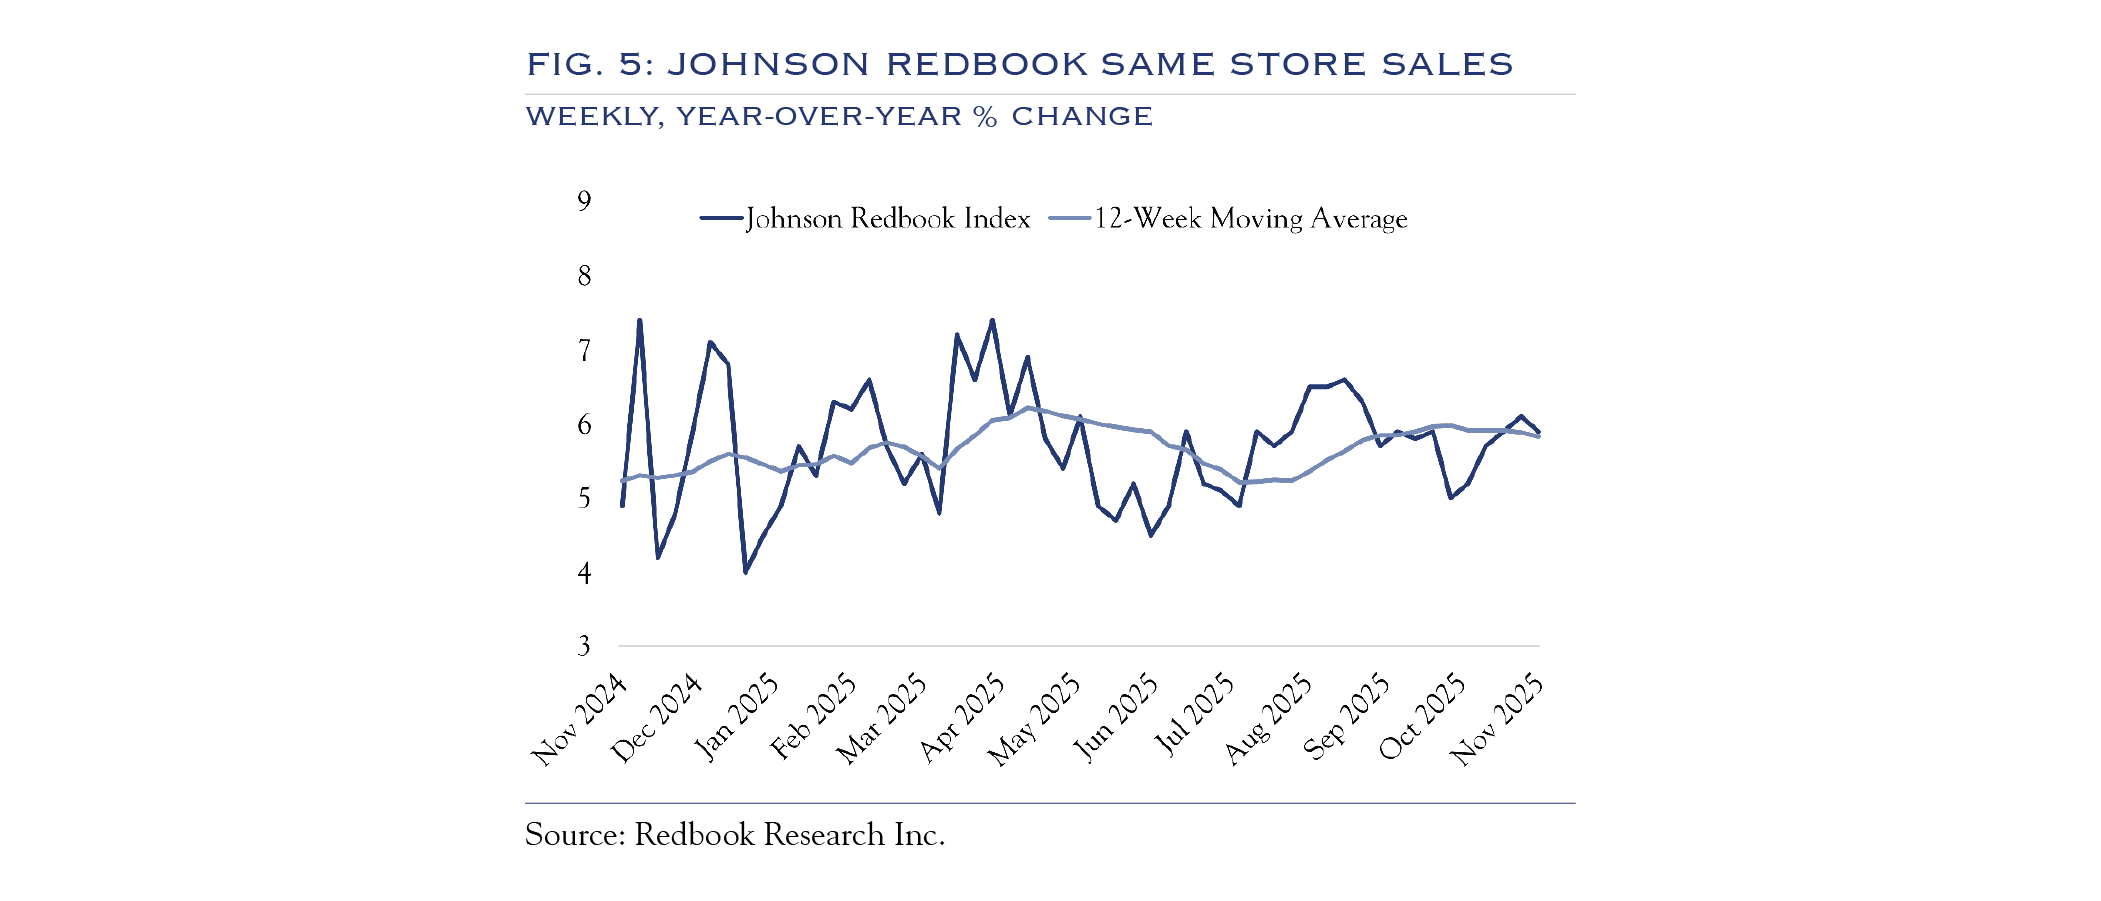
Figure 5 depicts the Johnson Redbook year-over-year change for weekly same-store sales. This dataset is a long-lived standard for retail sales across a broad mix of mainstream stores. Growth has been consistently strong.
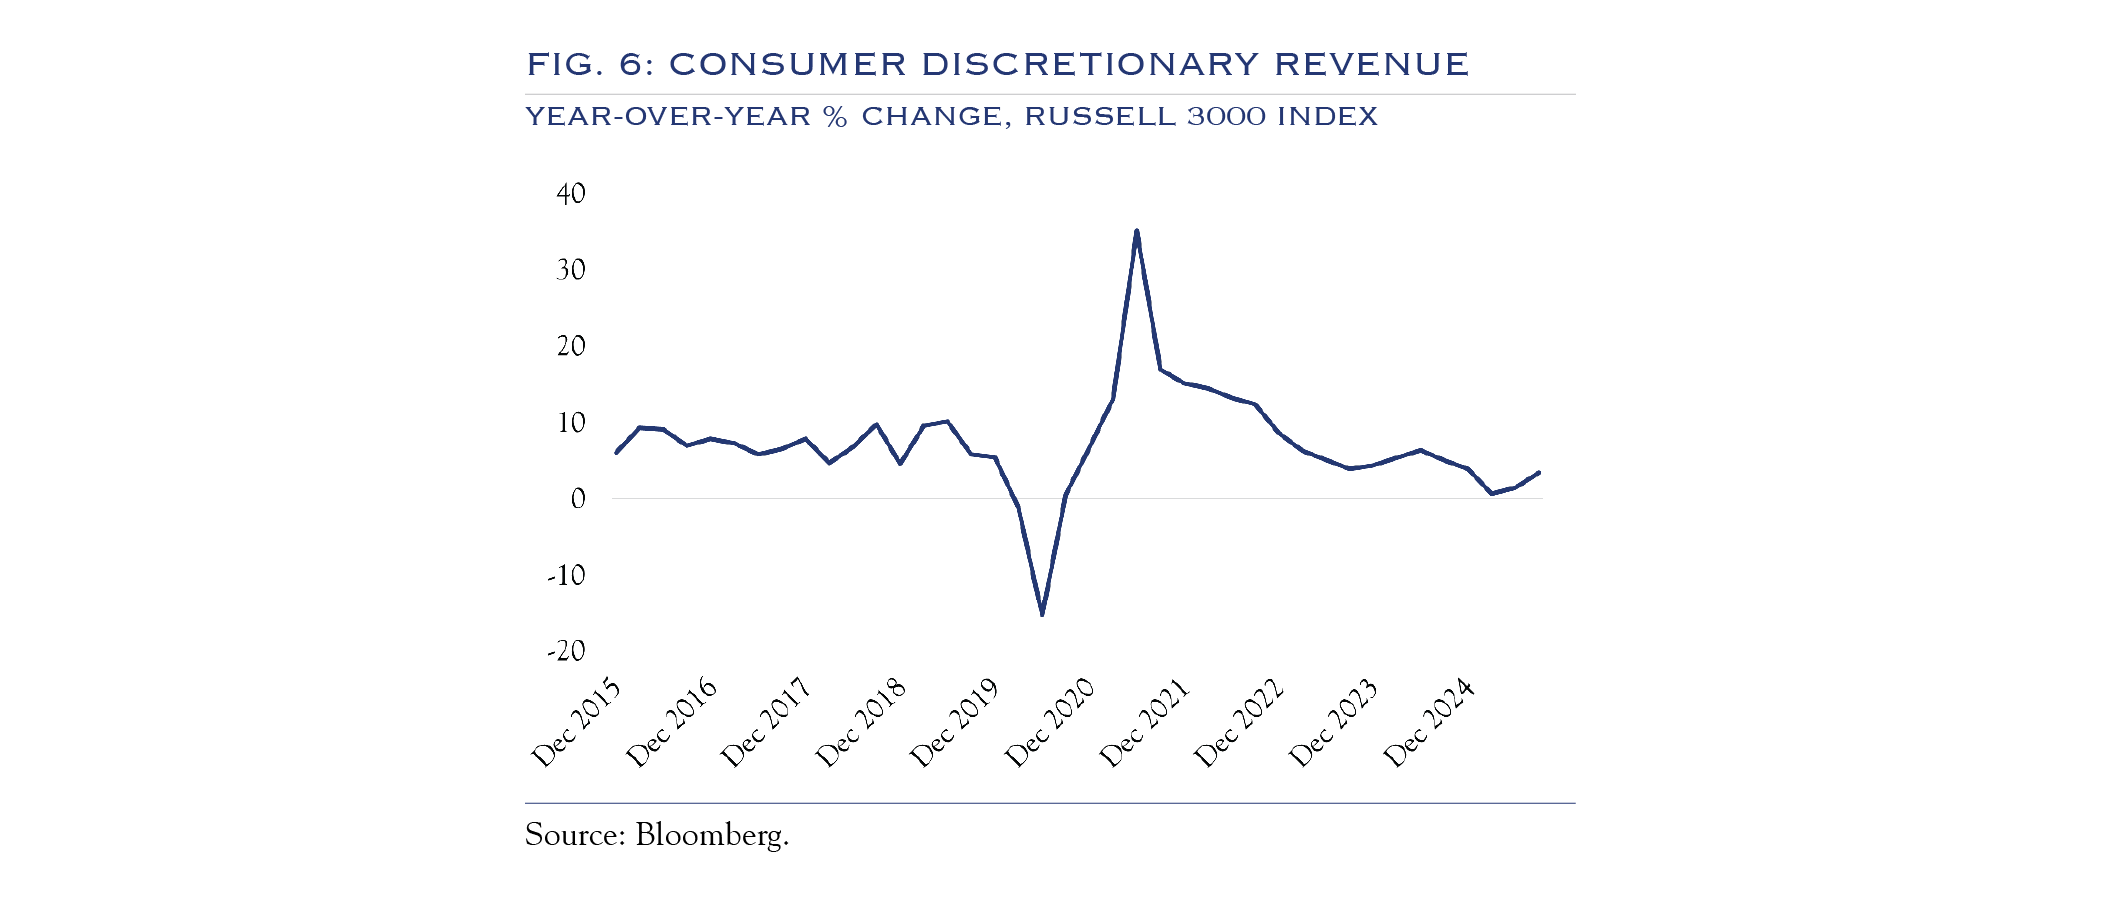
In Figure 6, we see the declining rate of revenue growth for Consumer Discretionary companies within the Russell 3000 Index.
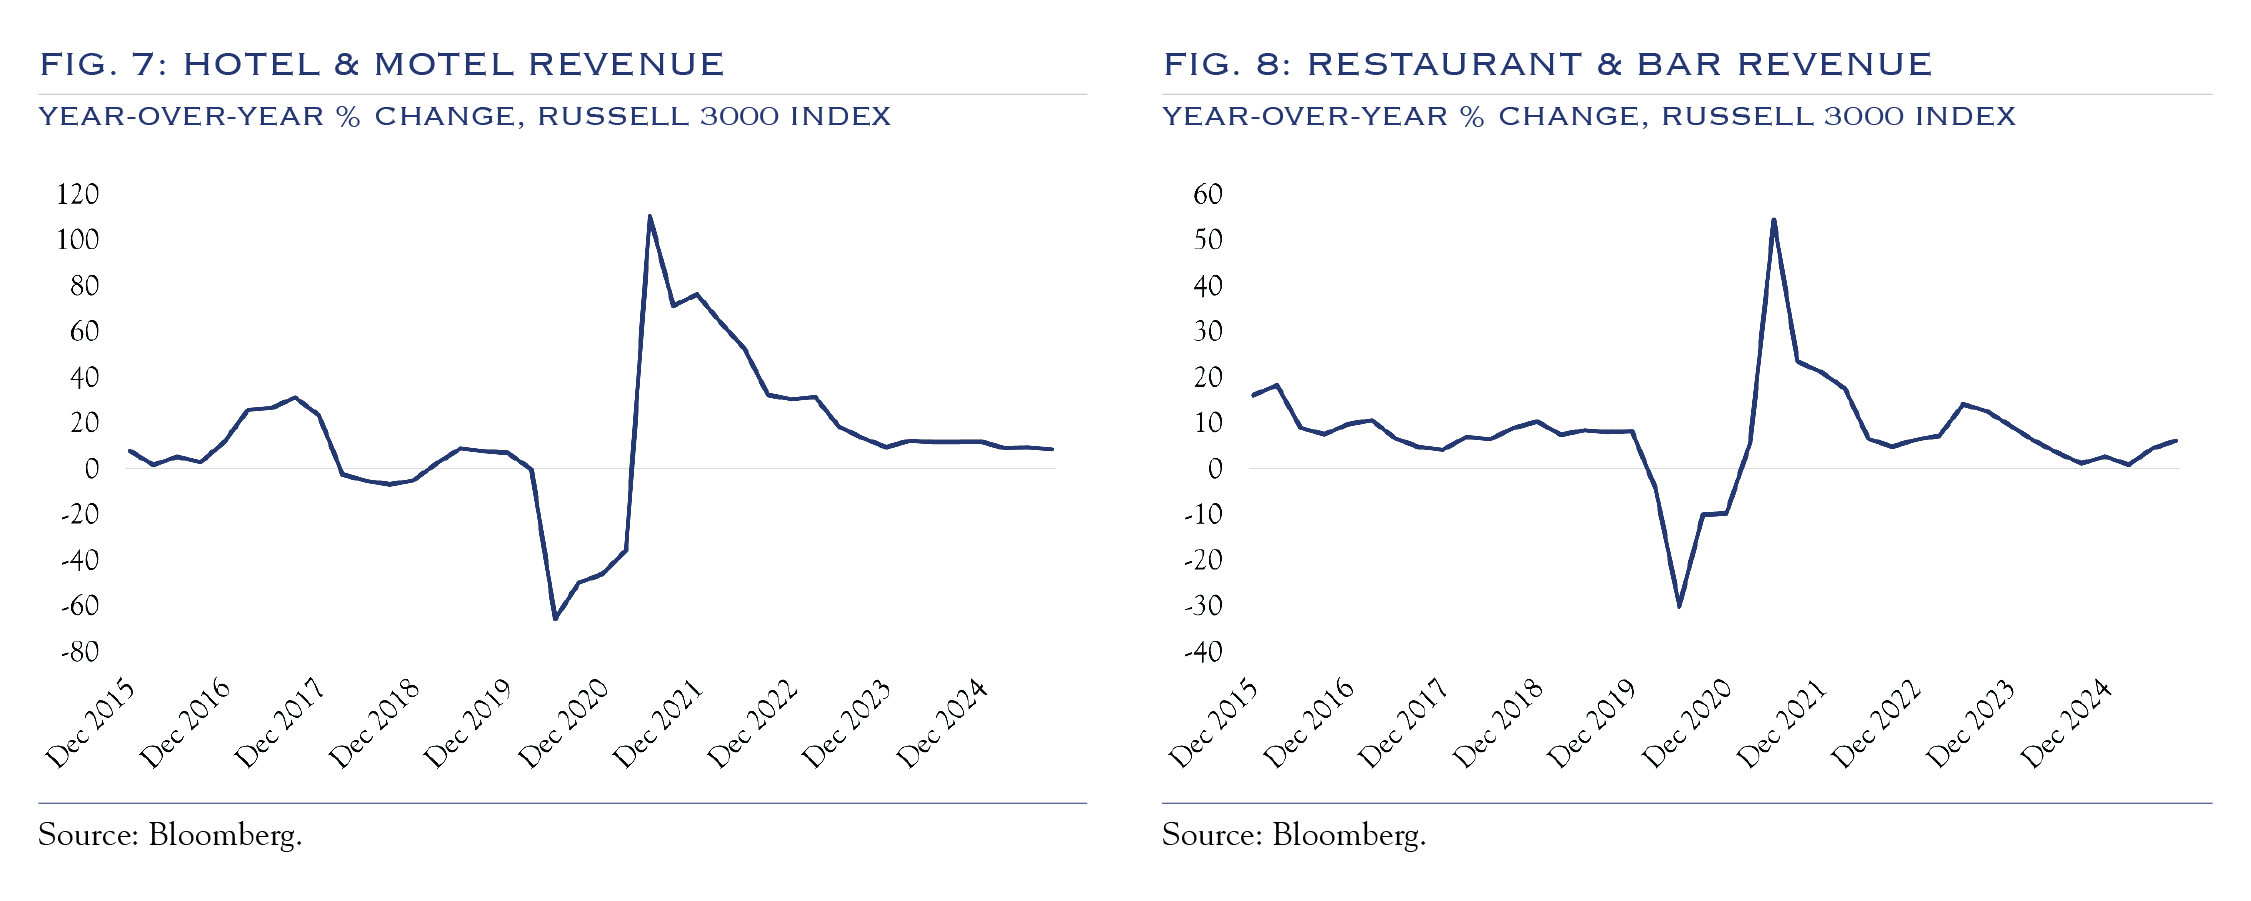
Within the consumer sector, we also zoom in on the hotel and restaurant industries and observe a trend of declining spending (Figures 7 and 8).
Overall, the consumer remains stable. A recent data point from Mastercard CFO Sachin Mehra, presenting at the November 19th Citi FinTech Conference, confirms generally solid spending, saying, “I guess, what I’ll say is, as I look at the data for the first two weeks of November, those trends very much continue to be intact. So, the consumer is still healthy. We continue to see good spending taking place as it relates to our business overall.”
However, unless payroll expansion or wages accelerate, spending growth is likely to remain modest, keeping a lid on overall economic growth.
Economic Outlook
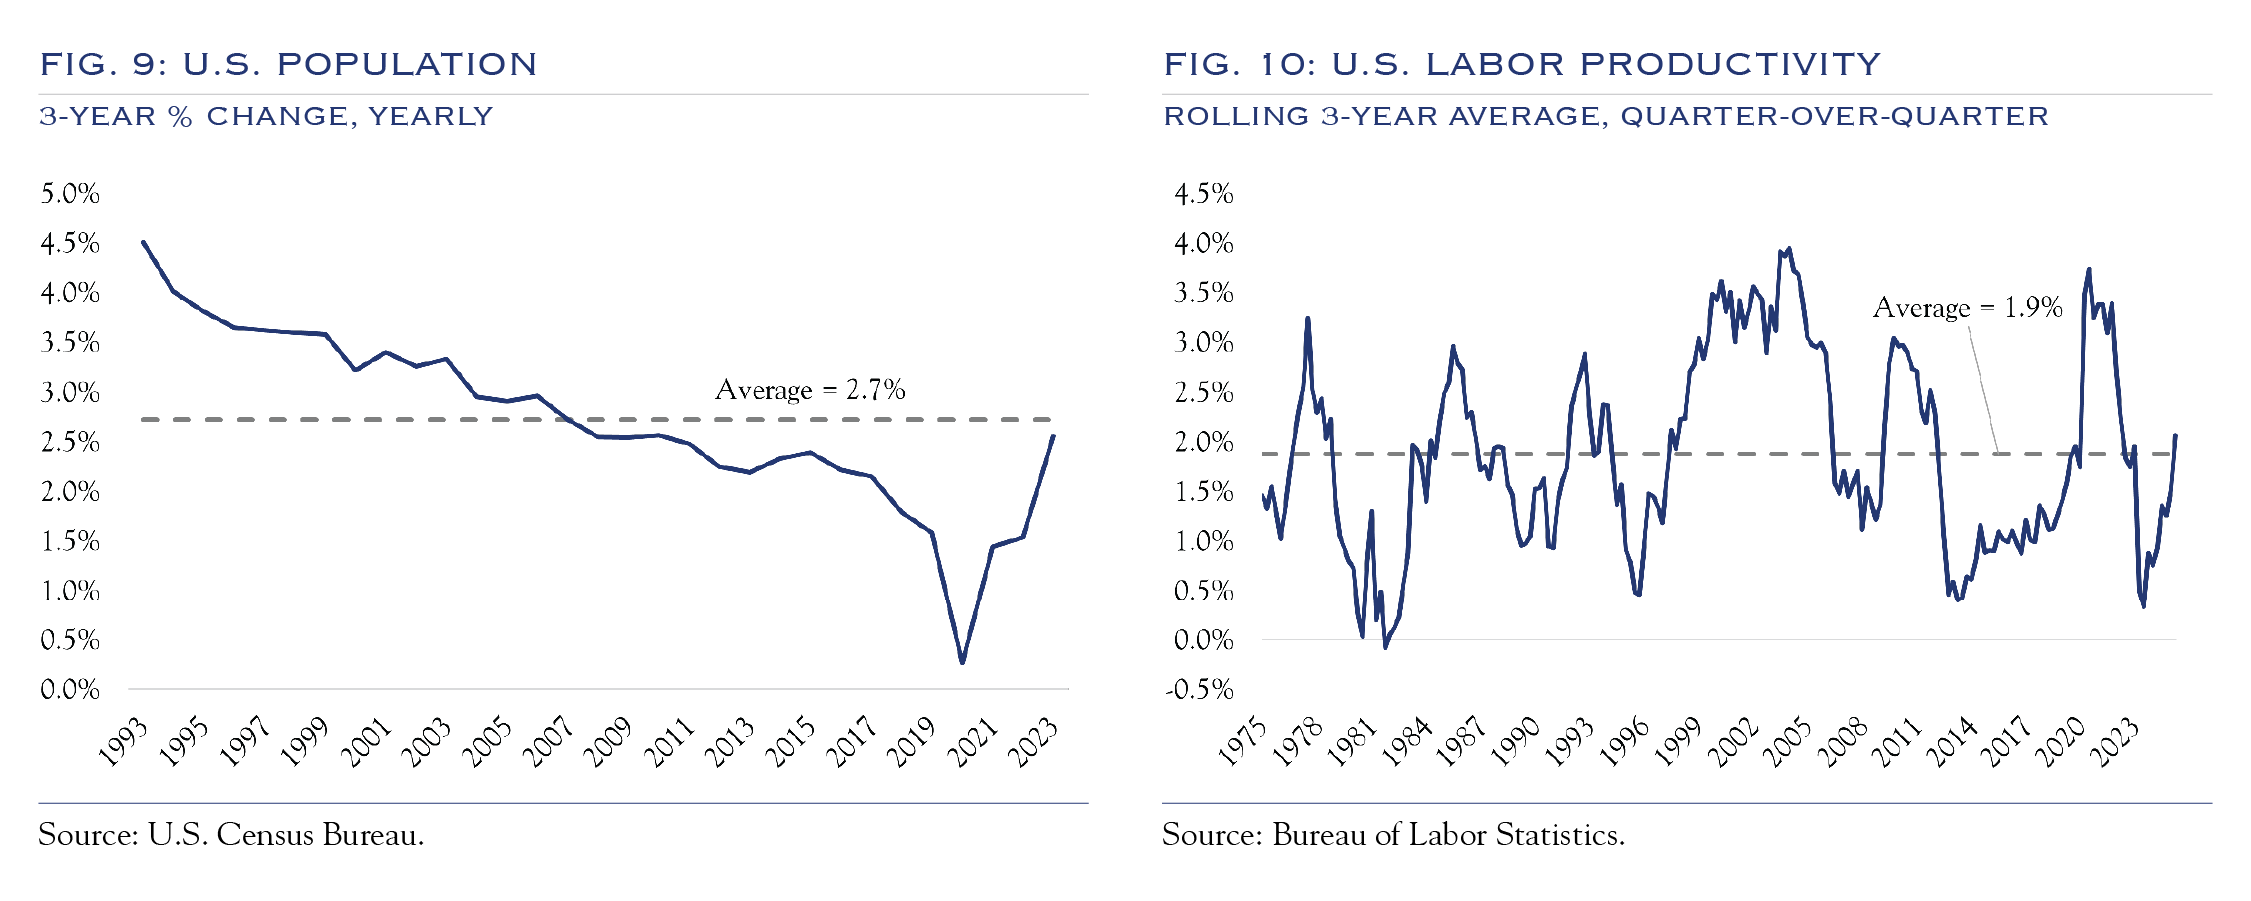
Overall, the economy is on solid ground, albeit with a wide range of powerful and conflicting factors at play. Our long-term growth estimate for the U.S. is derived from population growth and productivity (Figures 9 and 10). Slower growth in immigration has further reduced population growth, though an uptick in productivity growth is expected. Taken together and mapped to long-term trend rates, U.S. GDP should grow around a trend line of 2.0–2.5%.
Interest Rates
The current backdrop for interest rates, specifically the U.S. 10-Year Note, is influenced by a long list of factors that can be broadly categorized into two areas: creditworthiness (debt, deficit, tariffs, demographics, etc.) and market backdrop (Fed policy and investor preferences, inflation).

U.S. Sovereign Creditworthiness
For now, based on the experience of other developed nations (like Japan), the day of reckoning is likely in the distant future, unless another major economic crisis causes a further spike in debt-to-GDP.
With deficit spending still in place, debt levels continue to climb. The debt-to-GDP ratio has been around 125%, but has remained stable as economic growth has been solid. Tariff revenues are chipping away at the deficit, though the longer-term outlook for that revenue is unclear. Tariffs have brought an important shift in tone to the discussion as they have helped reduce the size of the problem. Nonetheless, with debt-to-GDP at elevated levels, we anticipate continued political pressure to keep the focus on stability in this metric. Based on historical patterns, the 2026 midterm elections are likely to result in some form of divided government, which will limit any form of ambitious legislation and keep debt-to-GDP at a manageable level. In prior instances where “bond vigilantes” increased pressure on lawmakers, symbolic efforts at managing the problem have been enough to keep markets in check. Eventually, a day of reckoning will emerge, and changes will need to be made. For now, based on the experience of other developed nations (like Japan), that day of reckoning is likely in the distant future, unless another major economic crisis causes a further spike in debt-to-GDP.
U.S. Treasury Note Market Backdrop
Employment conditions have been strong enough to prevent a faster pace of cuts, particularly with inflation remaining above the desired goal.
In formulating policy for the Fed Funds rate, the Federal Open Market Committee (FOMC) is confronting a tricky combination of facts. Inflation has remained above target for a sustained period, and labor market growth is cooling. The actual pace of rate cuts has been consistently slower than market expectations. Employment conditions have been strong enough to prevent a faster pace of cuts, particularly with inflation remaining above the desired goal.
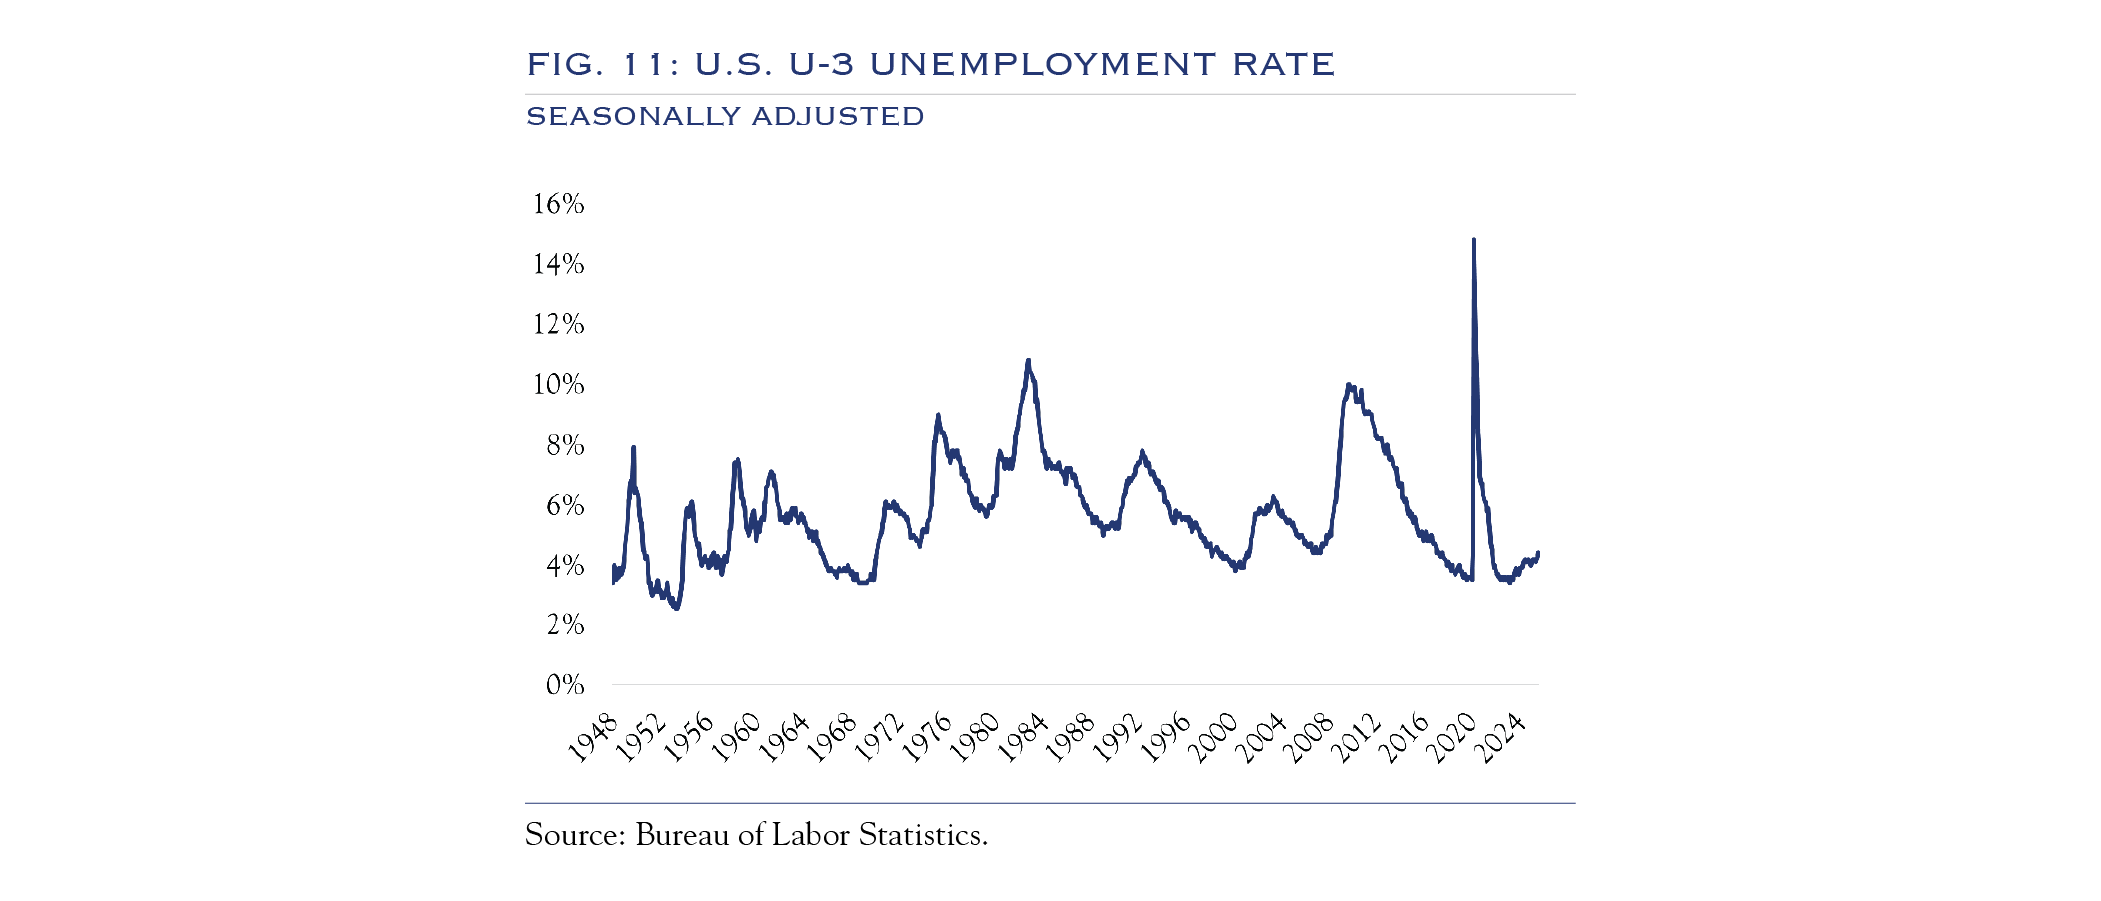
Unemployment has been rising (Figure 11), but remains at a modest 4.3%, compared with the 4.0% level that is traditionally considered “full employment.”
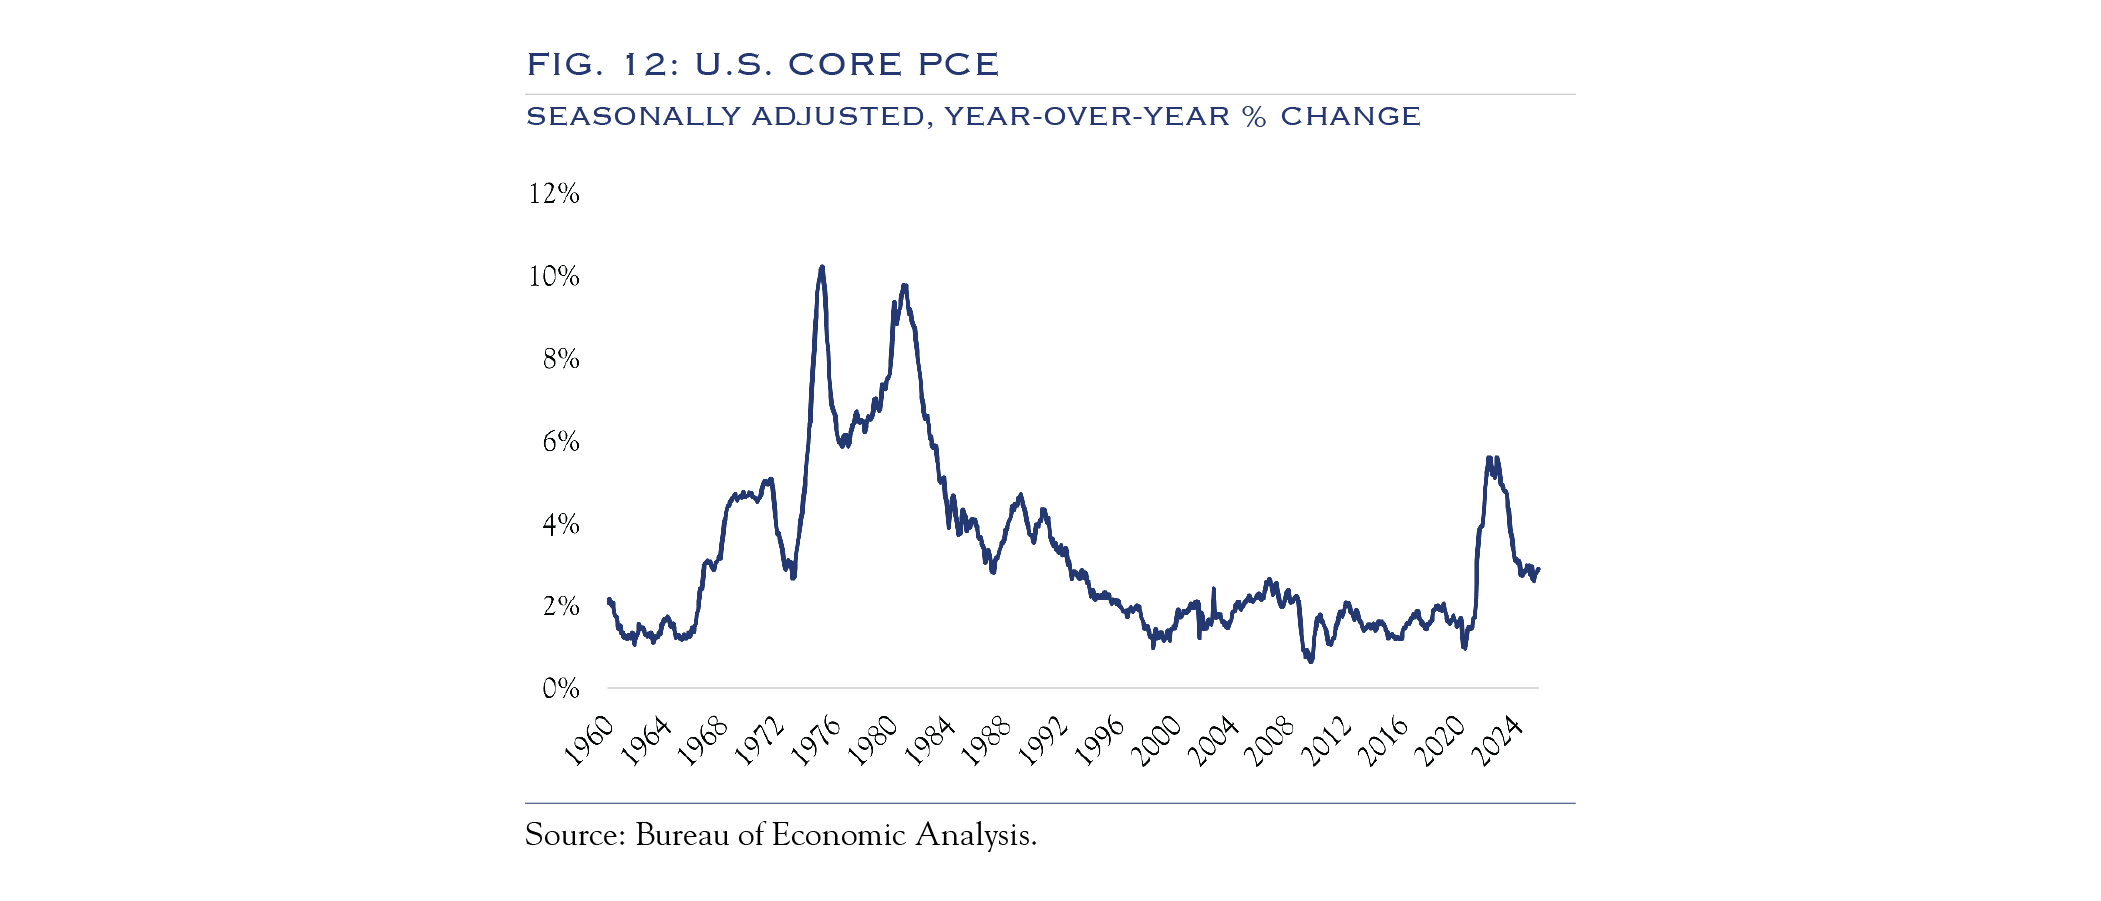
While most headline figures report on inflation using CPI, the Fed prefers the Core PCE metric. In Figure 12, we chart Core PCE on a long-term basis, which shows that inflation remains elevated at 2.9% for Core PCE, above the 2.0% target that had been maintained for much of the 20 years before the 2020 pandemic. Inflation has been stable, but it remains unresolved.
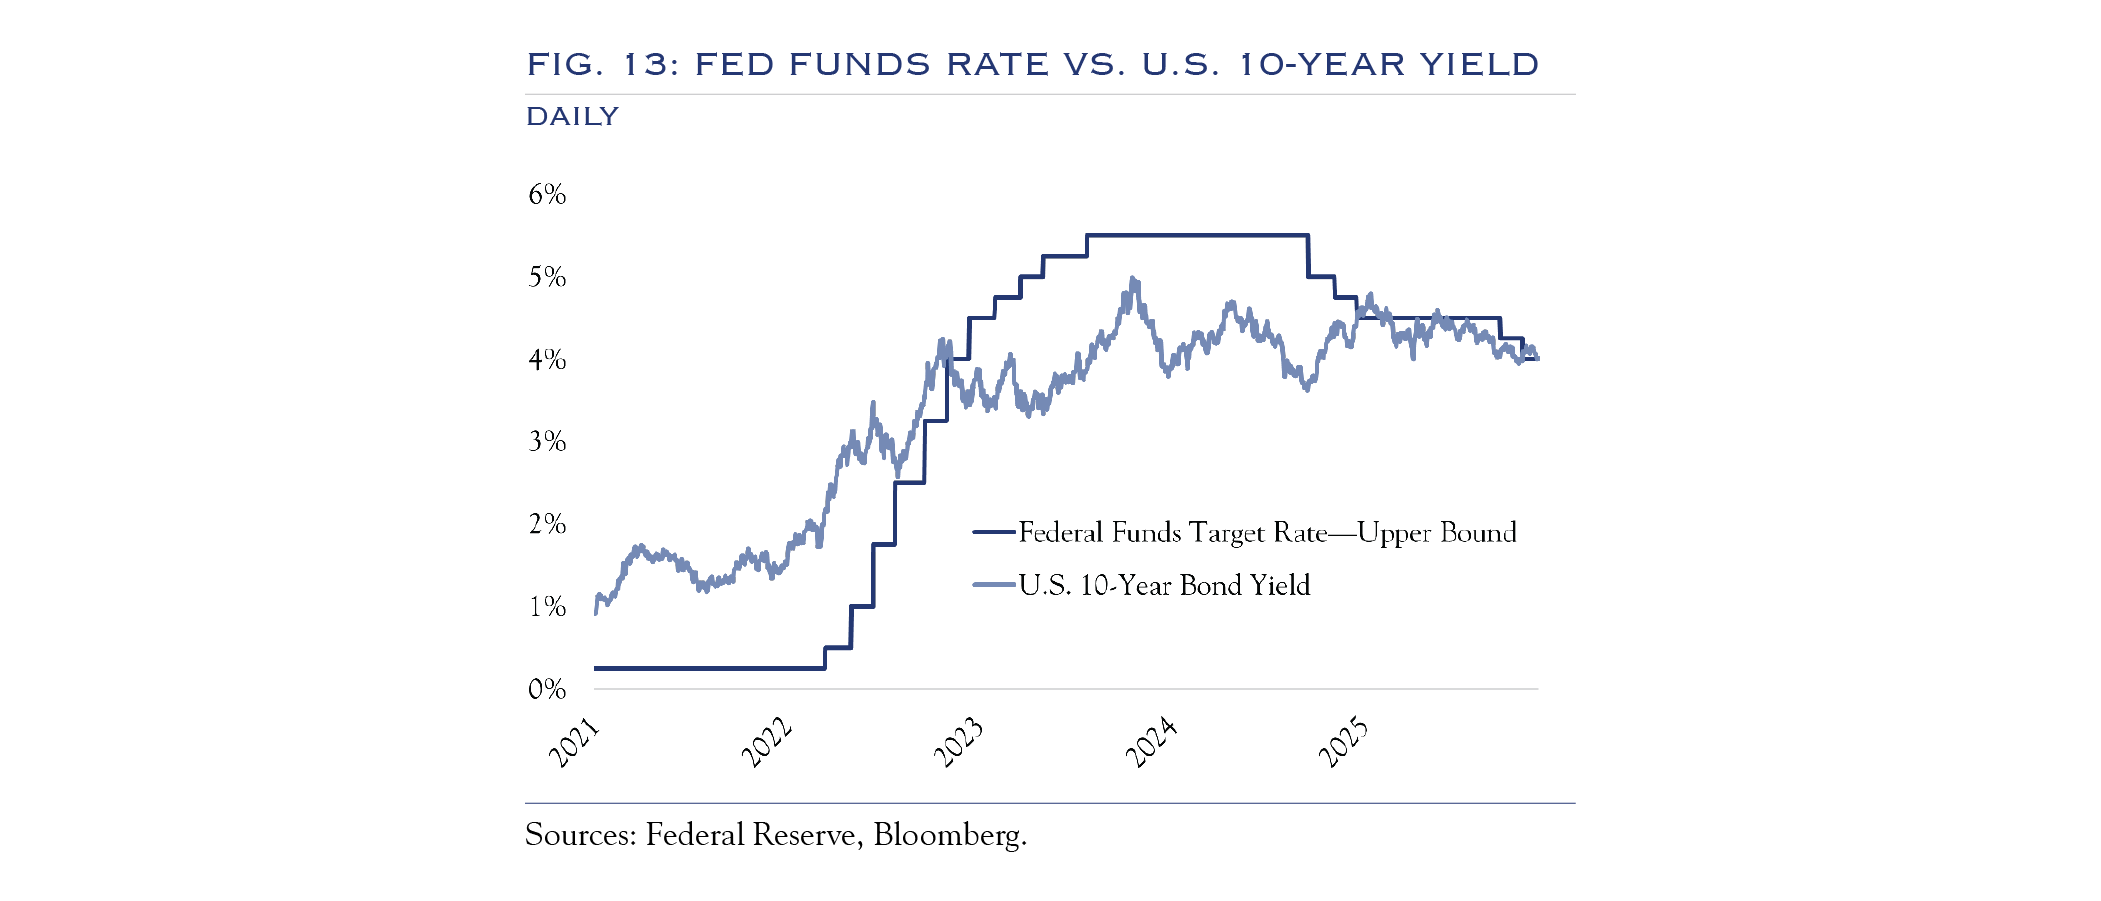
Fed policy and investor preferences both heavily influence yields on the benchmark U.S. 10-Year Note. Globally, investors remain comfortable with U.S. Treasuries, given a favorable growth backdrop, stabilization in debt-to-GDP, and a still compelling yield above 4.0%. With the Fed Funds rate likely remaining at 4.0% until the January 2026 meeting at least, yields on U.S. 10-Year Notes are likely to remain around 4.0% as well.
Rates Outlook
Figure 13 shows how closely the Fed Funds rate and the U.S. 10-Year yield have tracked in the past year. Looking further ahead, over the next three years, a gradual normalization of Fed Policy is expected to result in something closer to 3.0% for the Fed Funds rate, with the U.S. 10-Year following suit.

Equities
Over our full three-year forecast horizon, U.S. equities are a compelling asset class and are likely to generate significant earnings growth. Our research shows that, so long as the economy is expanding at 1.5% or better, stocks post earnings gains in the high single digits. Earnings growth could be even higher, as companies are bringing significant innovation to bear on boosting profit margins. Multiple sectors have profit margins in excess of pre-pandemic levels and at or near all-time highs. For the S&P 500 overall, margins continue to rise. Those record profit margins should spread as more companies utilize AI and robotics. For the most part, we look for stocks to trade higher concurrent with earnings growth. Valuations do present a challenge. Most valuation metrics are near all-time highs, surpassed only by epic peaks such as the 1999 internet bubble and the Nifty Fifty Era.
Our primary thesis on equities has been that earnings will power the path to gains, and valuations will remain supported via cuts, but capped by multiples that are rich vs. history. As P/E ratios have risen ever higher and market breadth has narrowed, the overall backdrop becomes riskier.

Valuation & Earnings
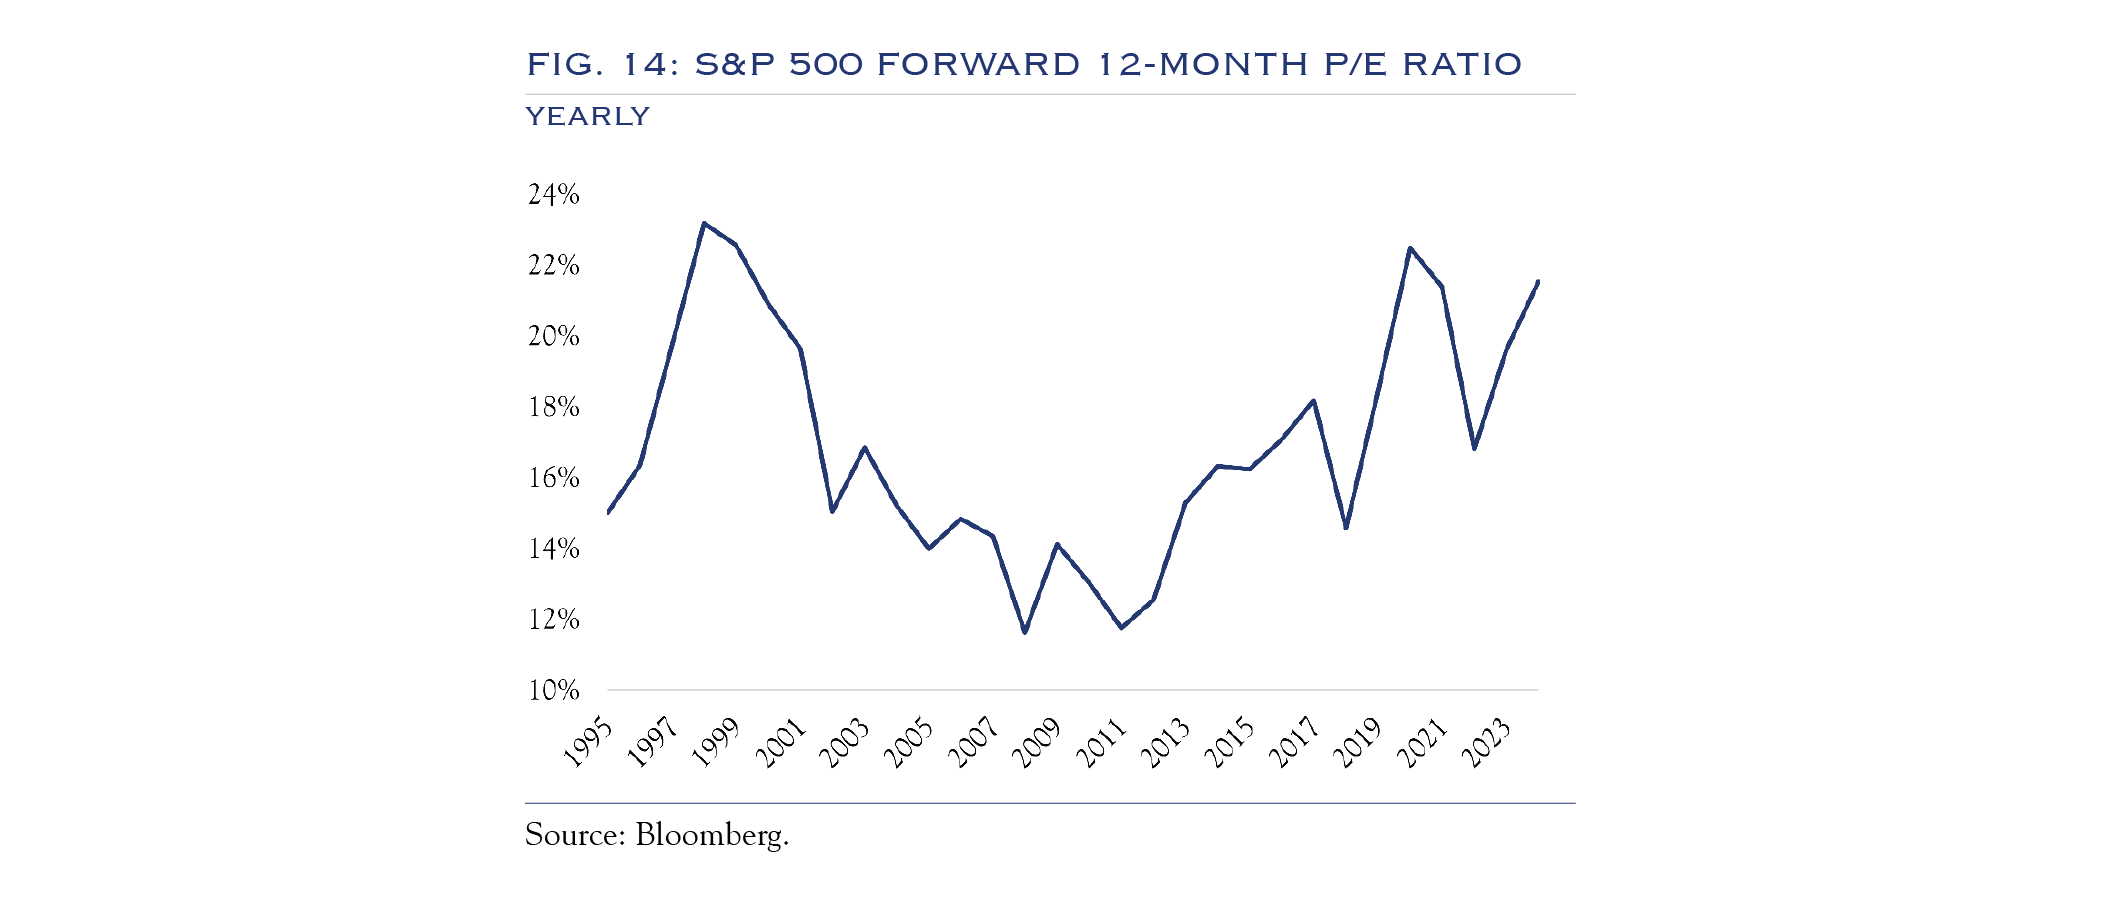
It is possible that valuations could stretch even higher, though this would require enthusiasm matched only by the greatest market peaks of all time.
In the short term, an important constraint for further equity appreciation is valuation levels. The forward P/E ratio on the S&P 500 has rarely been higher (Figure 14). While valuations are likely to remain supported by a stable economy and a gradual easing of the Fed Funds rate, the P/E ratio embeds a fair amount of good news. This situation sets up the risk of disappointment, as good news might not be good enough. It is possible that valuations could stretch even higher, though this would require enthusiasm matched only by the greatest market peaks of all time.
In a highly polarized world, this seems hard to conjure. Consider that the late 1990s saw a balanced budget and very high approval ratings for the president and politicians generally. Today, most economic survey data is highly influenced by political affiliation. We suspect that some of those views may lead to a limitation on peak equity valuations. Another possibly confounding factor for a return to peak valuations is the breadth of areas that are currently “expensive.” Private markets, credit risk, gold, bitcoin, and risk-on areas such as meme stocks and zero-day-to-expiration (0DTE) options, as well as the rise in prediction markets and gambling, are providing outlets for fuel that might otherwise power valuations to higher levels. Overall, valuations are mostly justified, but unlikely to rise further, and, at these levels, are subject to risk of disappointment.
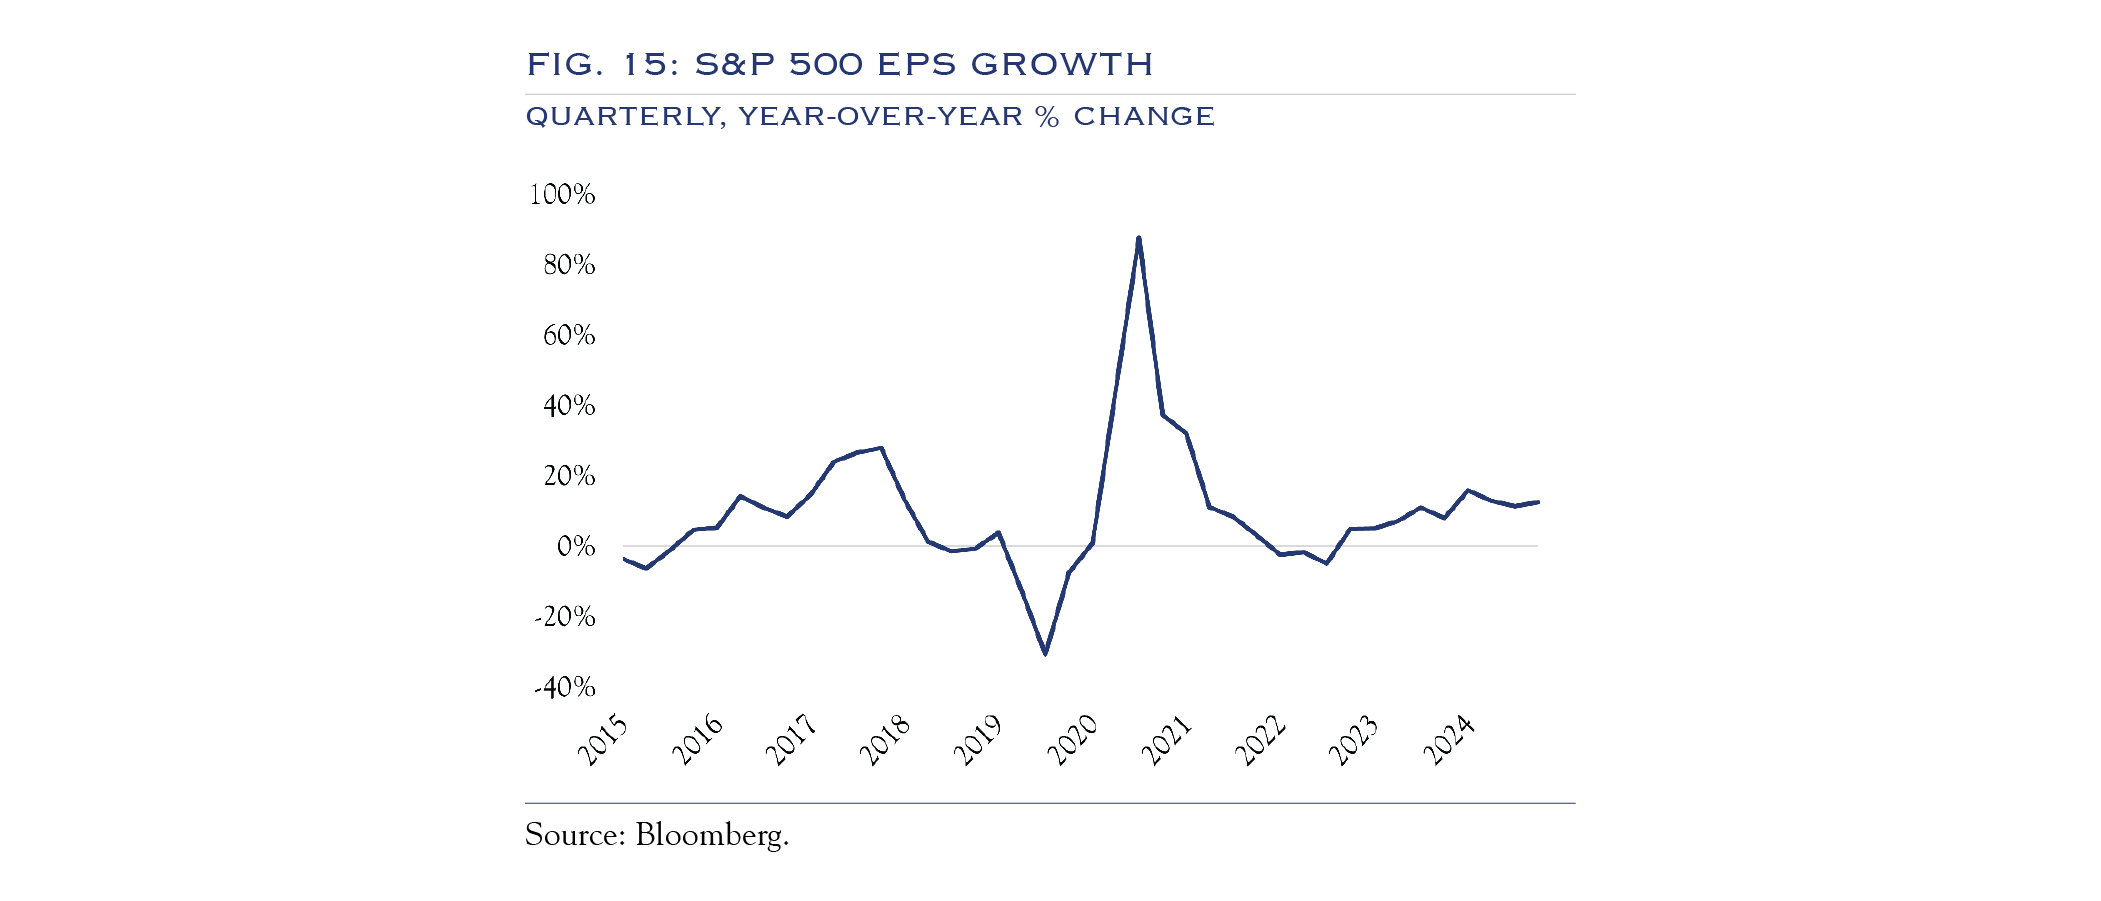
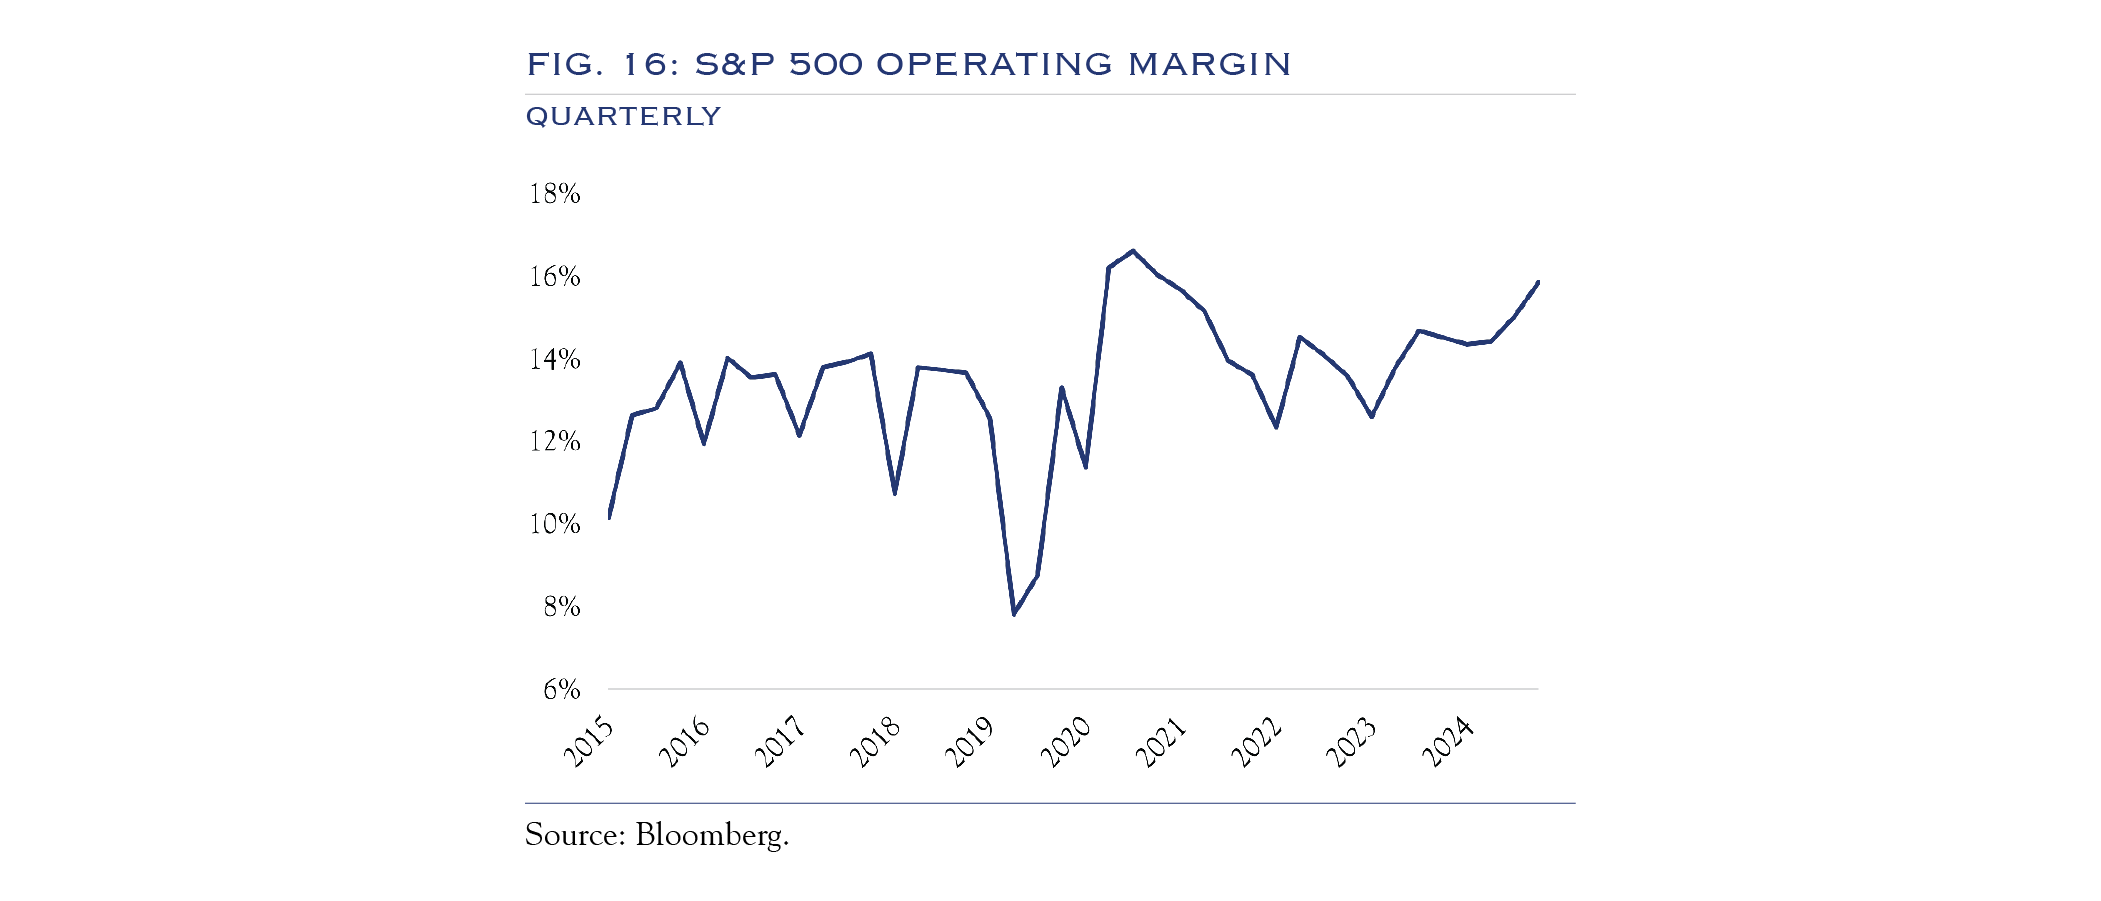
While valuations are a constraining factor, earnings growth will continue to power stocks higher (Figures 15 and 16).
Equity Outlook
For the time being, allocating at a risk-neutral posture is a prudent move. We are in a very high valuation environment, and there are a number of important and unclear issues unfolding in the coming months. Our November 2025 letter outlined several risk factors, including a narrowing segment of stocks driving the advance, concerns over opaque lending practices and credit risk, and a stalemate in the job market. Meanwhile, a lot of good news is priced in related to valuations. Thus, disappointments vs. expectations (even if not bad news) can present problems.
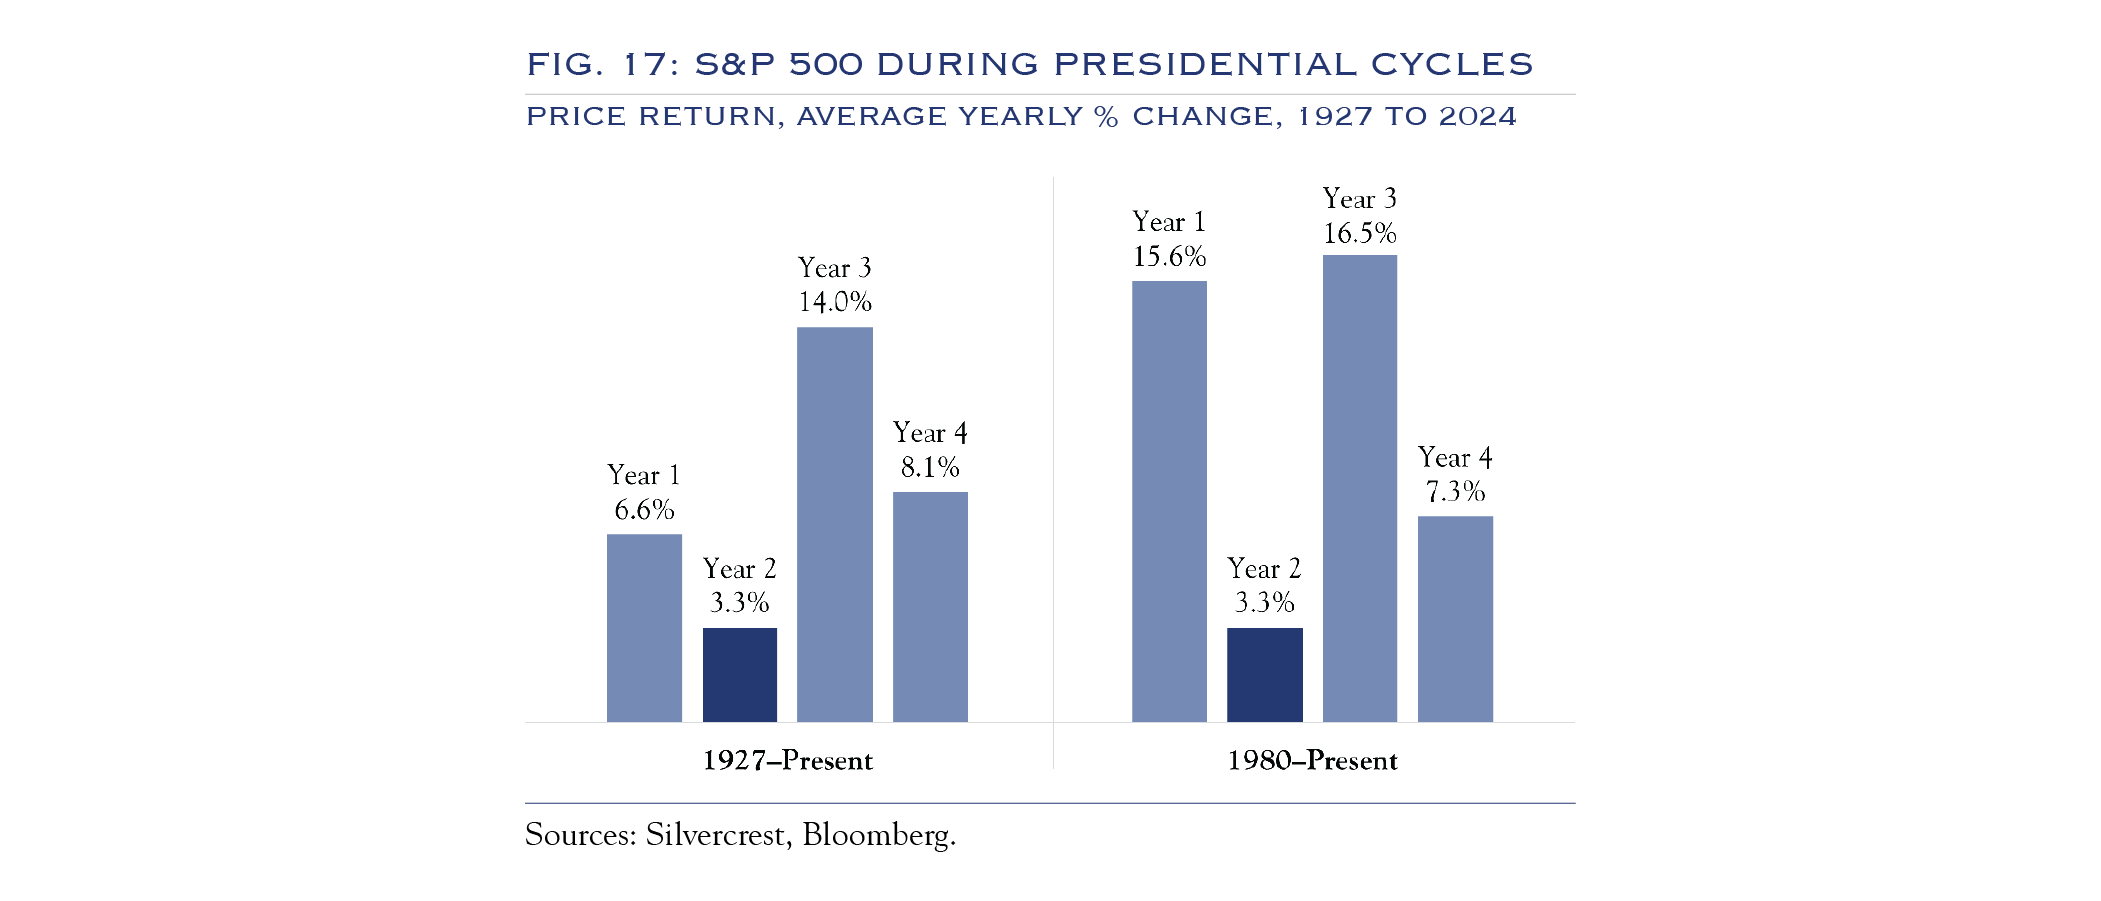
Looking ahead to 2026, the calendar year falls in the worst year of a presidential cycle for stocks, which historically means equities struggle leading into the midterm election and then experience a clearing-the-deck reset with better results in the late part of the year (Figure 17).
Over the next three years, stocks are expected to track earnings growth, likely at high single-digit levels. In the short term, the early part of next year will bring more clarity on the risk factors outlined above. Key events include:
- The January–February 2026 earnings season
- Progress on Fed rate cuts, and whether they are happening for good or bad reasons
- Signals on whether credit risk is broadening, and
- Clearer data on the labor market and consumer, which appear to be slowing but are currently muddied by data-collection issues and the partial shutdown, lingering effects of DOGE, and AI implications for new hires
Overall, it is a message to be risk-neutral on a tactical basis, while remaining bullish over the entire three-year horizon.
Themes
1. The AI Arms Race
It will be great for the economy, but some early leaders will not win. The users of the technology could be the true winners.
2. Small Caps—Why We Like Them Now
Valuation, diversification, and timing are driving our interest.
3. Hidden Risks at the Summit?
Now more than ever, traditional labels don’t apply. AI is pervasive and influencing valuation and credit risk far beyond obvious areas.

Theme 1: The AI Arms Race
The development of AI is likely to be one of the most profound advancements in technology of all time. Yet, its benefits will likely accrue to productivity and the economy at large rather than one player winning it all. In other words, the AI boom will shift from early entrants to the broader economy, from builders to users. There is significant potential for productivity and margin gains across a large swath of the economy.
The book Nathaniel’s Nutmeg tells the story of Captain Nathaniel Courthope and his journey to Run, a small island of tremendous significance in the 17th century. Though many ships had been destroyed trying to find Run, Nathaniel was undeterred in his quest for nutmeg on the island described as “the most talked about island in the world, a place of such fabulous wealth.” At the time, nutmeg was the most coveted spice as it “rocketed in price when the physicians of Elizabethan London began claiming their nutmeg pomanders were the only certain cure.” The price markup from harvest on Run to London was “a staggering 60,000 per cent.” Any student of markets will know the rest of the story. Massive risks were taken, competition ensued, and eventually the spice was available anywhere at any time—currently $7.99 for five seeds, delivered via Amazon by tomorrow morning.
The AI race is confronting similar issues. The prize is valuable, and the competition is intense. New capabilities are attracting massive amounts of capital investment from a range of players, especially in the U.S. and China. Given the size of each domestic market and links to all regions and countries, Dan Wang, author of Breakneck: China’s Quest to Engineer the Future, said of the global tech competition, “It is Americans and Chinese—Silicon Valley, Shenzhen, Wall Street, and Beijing—that will determine what people everywhere will think and what they will buy.” This race will continue at a fast pace for the foreseeable future.
One immediate problem is that the sheer amount of demand in the space creates difficulties in assessing timelines, which in turn can suppress rates of return. In recent weeks, several stories have highlighted issues with accessing power to operate data centers, and other supply chain concerns may also make it difficult to gauge the time to completion for some projects accurately. For context, an investment that would return 2x over a three-year time horizon generates a compelling 26.0% internal rate of return (IRR). If the same project were to take five years, the IRR would drop to a more pedestrian 14.9%, not to mention that assumptions and technologies would further evolve over a longer horizon.
Another potential problem comes in mapping out an endgame. Recent research from JP Morgan puts some parameters around the total number of users and the monthly fees needed to justify the investment from the firms building out models (such as ChatGPT). In some sense, the numbers can seem justifiable. One has to wonder if the models will go the way of nutmeg, becoming fairly ubiquitous and less lucrative. To date, no single model has created such a massive lead or buy-in to raise switching costs or gain pricing power. Yes, each model has various strengths and weaknesses, but comparing across providers is more akin to internet browsers than, say, streaming services.
For the economy at large, this is a fantastic once-in-a-lifetime benefit. The development of AI is likely to be one of the most profound advancements in technology of all time. Yet, its benefits will likely accrue to productivity and the economy at large rather than one player winning it all. In other words, the AI boom will shift from early entrants to the broader economy, from builders to users. There is significant potential for productivity and margin gains across a large swath of the economy.
Theme 2: Small Caps—Why We Like Them Now
Valuation Advantage
Unlike their large-cap brethren, small caps are trading at valuation levels below their own long-term average. To compare valuations, we review the trailing 12-month P/E ratio for the large-cap Russell 1000 Index and the S&P SmallCap 600 Index. We use the S&P 600 because it has a higher-quality profile than the Russell 2000, thereby avoiding excessive valuation noise from unprofitable companies in the Russell 2000. Small caps are trading at historically “cheap” levels, while large caps are “expensive” relative to their own history.
Long Cycles of Underperformance Precede Long Cycles of Outperformance
Small caps hit a significant turning point in the late ’90s when reaching a ten-year, –7% annualized performance lag. Additionally, long-term studies from Furey Research Partners show major inflections at similar levels in the 1930s and 1950s. Historically, the first phase of a turnaround sees more speculative corners of the small-cap universe rally first. Often, this is manifest in covering short positions, and indeed, heavily shorted stocks have rallied, dragging unprofitable and speculative corners of the index to significant gains in recent weeks. Ultimately, for the recent surge in small caps to be sustainable, leadership must extend to more durable corners of the small-cap universe and be fueled by factors that are sustainable over the long term, such as earnings. This broadening of earnings growth is on the cusp of unfolding. Investor attention has begun to scrutinize the valuation of larger participants building the AI infrastructure and tools.
Meanwhile, evidence is mounting that small companies of all stripes are becoming increasingly active users of AI, potentially leading to boosts in productivity, profit margins, and earnings. This trend can be seen via earnings transcripts, news reports, and, for very small companies, in a U.S. Chamber of Commerce study. As of November 2025, the rally has been running for eight months, placing the market squarely within the window when the transition to quality-driven leadership has historically occurred.
Small Caps & Privates
The deal size for some private investments overlaps with the market caps of small companies, and many excellent companies have elected to remain private and/or go public at levels comparable to those of large-cap companies. These trends are likely to continue; however, investors do not need to choose between private investments and small caps. In fact, several key differences highlight the appeal of small caps for portfolio construction. Prudent portfolio construction should emphasize diversification of general characteristics.
Diversification—Small Caps Protect During a Change in Mega Cycles
In the aftermath of the most notorious instance of valuation dispersion during the 1999 Internet Bubble, high-quality small-cap companies provided portfolios with significantly greater diversification benefits.
Small caps performed significantly better during the 1999–2000 cycle shift. From March 2000 to September 2002, the small-cap S&P 600 experienced a modest –8.4% decline, compared with the –43.9% decline in the large-cap Russell 1000. At a 10% portfolio weight, this would provide 355 basis points of additional portfolio return. Small caps outperformed handily over the ten years from 1995 to 2005. The key is to add the allocation before the change in the cycle. While the current large-cap technology cycle may not have an imminent end, it will eventually come to a close. Increasing small-cap exposure now could bring significant diversification benefits.
The Nifty Fifty era experienced a similar outcome: what was working best and most popular suffered the most when the environment changed. Small caps also provide fundamental diversification through a mix of companies across sectors and geographies. Small caps offer greater exposure to Health Care and Industrials, and have a much more domestically focused revenue base.
Timing: Why Now?
Smaller companies will be the ultimate beneficiaries of the AI revolution. For now, the focus is on the technology’s builders, who are often large-cap companies. Eventually, the focus should shift to technology users, with margin gains spread across all market-cap segments, thereby leveling the playing field as small companies adopt new AI use cases.
We see several catalysts for small-cap performance:
- First, recently enacted legislation and the upcoming midterm election cycle make it likely that ample resources will be deployed in the domestic economy. Historically, domestic activity has benefited small caps.
- Second, after several false starts, M&A activity seems to be on the rise once more. With ample “dry powder” from private firms and an increased appetite for processing a deal backlog, M&A activity should continue rising. Typically, this activity benefits small-cap companies, as they are often the acquisition targets.
- Third, an improved interest rate backdrop brings two benefits to small caps. Smaller companies often have a higher proportion of floating-rate bank debt and generally longer-maturity bond issuance than large caps. In these situations, lower rates bring a disproportionate potential benefit. The decline in rates alleviates the financing stress (real or perceived) that is often a concern for smaller companies. Further, an extended cycle of interest rate declines, such as the one we are likely to see over the next 18 months, typically boosts investor interest in smaller companies, partly because they are more economically sensitive.
Smaller companies will be the ultimate beneficiaries of the AI revolution. For now, the focus is on the technology’s builders, who are often large-cap companies. Eventually, the focus should shift to technology users, with margin gains spread across all market-cap segments, thereby leveling the playing field as small companies adopt new AI use cases.
Theme 3: Hidden Risks at the Summit?
Ed Viesturs, one of the world’s most prominent mountain climbers, has this to say about climbing a mountain: “You’re happy that you’re there but you can’t really relax and let your guard down because you know that you still have to get down. I always tell people that getting to the summit is optional but getting down is mandatory.”
With so much good news already priced in, it is essential to pay close attention to risk levels. Staying near risk targets, monitoring liquidity, and maintaining diversification across strategies are crucial components of risk management. Furthermore, in an environment that has been driven by two powerful themes—AI and private investing—it is important to identify hidden correlations.
This description is particularly relevant to investing and is especially timely in an environment of elevated valuations. With so much good news already priced in, it is essential to pay close attention to risk levels. Staying near risk targets, monitoring liquidity, and maintaining diversification across strategies are crucial components of risk management. Furthermore, in an environment that has been driven by two powerful themes—AI and private investing—it is important to identify hidden correlations.
Simpson’s paradox describes a situation where a relationship can appear in multiple groups but not in the aggregate. The themes of AI and private investing are exerting a powerful influence over business activities, and non-traditional techniques can be valuable in assessing risk. A “hidden risk” phenomenon occurs when individual securities appear to be uncorrelated using traditional statistical techniques, but may in fact be exposed to the same underlying fundamental risks. In evaluating baskets of securities, we have observed that certain groupings are less correlated than one might expect, even though they have ties to a common sector. Others are more correlated, even when coming from different sectors. These findings could suggest that traditional risk models may be understating risk, creating an opportunity for qualitative analysis to add value. Many modern Value at Risk (VaR) models are based on correlation. Current correlation readings could be understated in the event of a change in market leadership around the AI buildout.
If it looks like an AI stock and trades like an AI stock, even if it’s not an AI stock, it’s probably going to rise and fall with the fate of the AI trade. Likewise, credit risk is credit risk, whether housed in a bond, a traditional portfolio, or a private vehicle.

Asset Allocation Guidance

Level of Risk
Continued gains in equities are expected, driven primarily by earnings growth, which will be powered by profit margin expansion. Over the past several years, corporate America has been especially dynamic in adapting to massive change. This dynamism, along with advances in technology, should drive higher profits, with stocks following suit. However, given the elevated state of valuation, risk and reward have become more balanced, and we recommend a posture that is near target ranges for exposure.
Location of Risk
Style

We continue to advocate for a balanced approach between growth and value. The degree to which individual companies can adapt to a rapidly changing environment is more likely to determine success than their designation within benchmark indices. The economy should remain on solid ground, neither accelerating nor falling into recession, so a balance between cyclical and less cyclical components is warranted. Additionally, the degree of exposure to the AI theme has emerged as a new and powerful factor that cuts across value and growth.
Market Cap

Large-cap companies will continue to benefit from their scale, including access to capital markets, the ability to invest in new technologies, and the recipients of index flows. We have maintained and will continue to maintain an outsized allocation to smaller companies. As noted above, the valuation gap, diversification benefit, opportunity for profit expansion as the AI wave unfolds, M&A environment, and tailwinds from eventual rate cuts present a compelling mix.
Geography

Given the upcoming 250th anniversary, we have focused mainly on the outlook within the United States; however, we maintain our diversified posture across geographies. Valuation and growth opportunities exist across a broad range of industries, regions, and countries, and we rely on active management to identify these opportunities. Currency should be largely neutral, with a stable to slightly declining U.S. dollar, although the U.S. has an edge over most developed markets due to better demographics and expected growth. Pockets of emerging markets also offer solid growth prospects.
Fixed Income

Credit
We emphasize extreme selectivity with credit risk. Security selection is paramount, with active management as a critical component of avoiding potential problems. We favor more liquidity and higher quality within the credit space. A recent Bloomberg story highlighted the range of prices used by various market participants for the same loan. Given the massive growth in private funding markets against a mostly benign backdrop and with interest rates remaining stubbornly high, it is no surprise that some situations have gone haywire. Our work has consistently emphasized the importance of diligent credit underwriting and security selection, rather than generic and broad exposure.
Rates
Interest rates for the U.S. 10-Year Note will generally follow the path of Fed policy for the foreseeable future. This means that rates will decline, but slowly. Fed policy is constrained by stubborn inflation and a steady but weakening job market. So long as inflation and employment remain mostly stable, rate pressure will ease slowly.
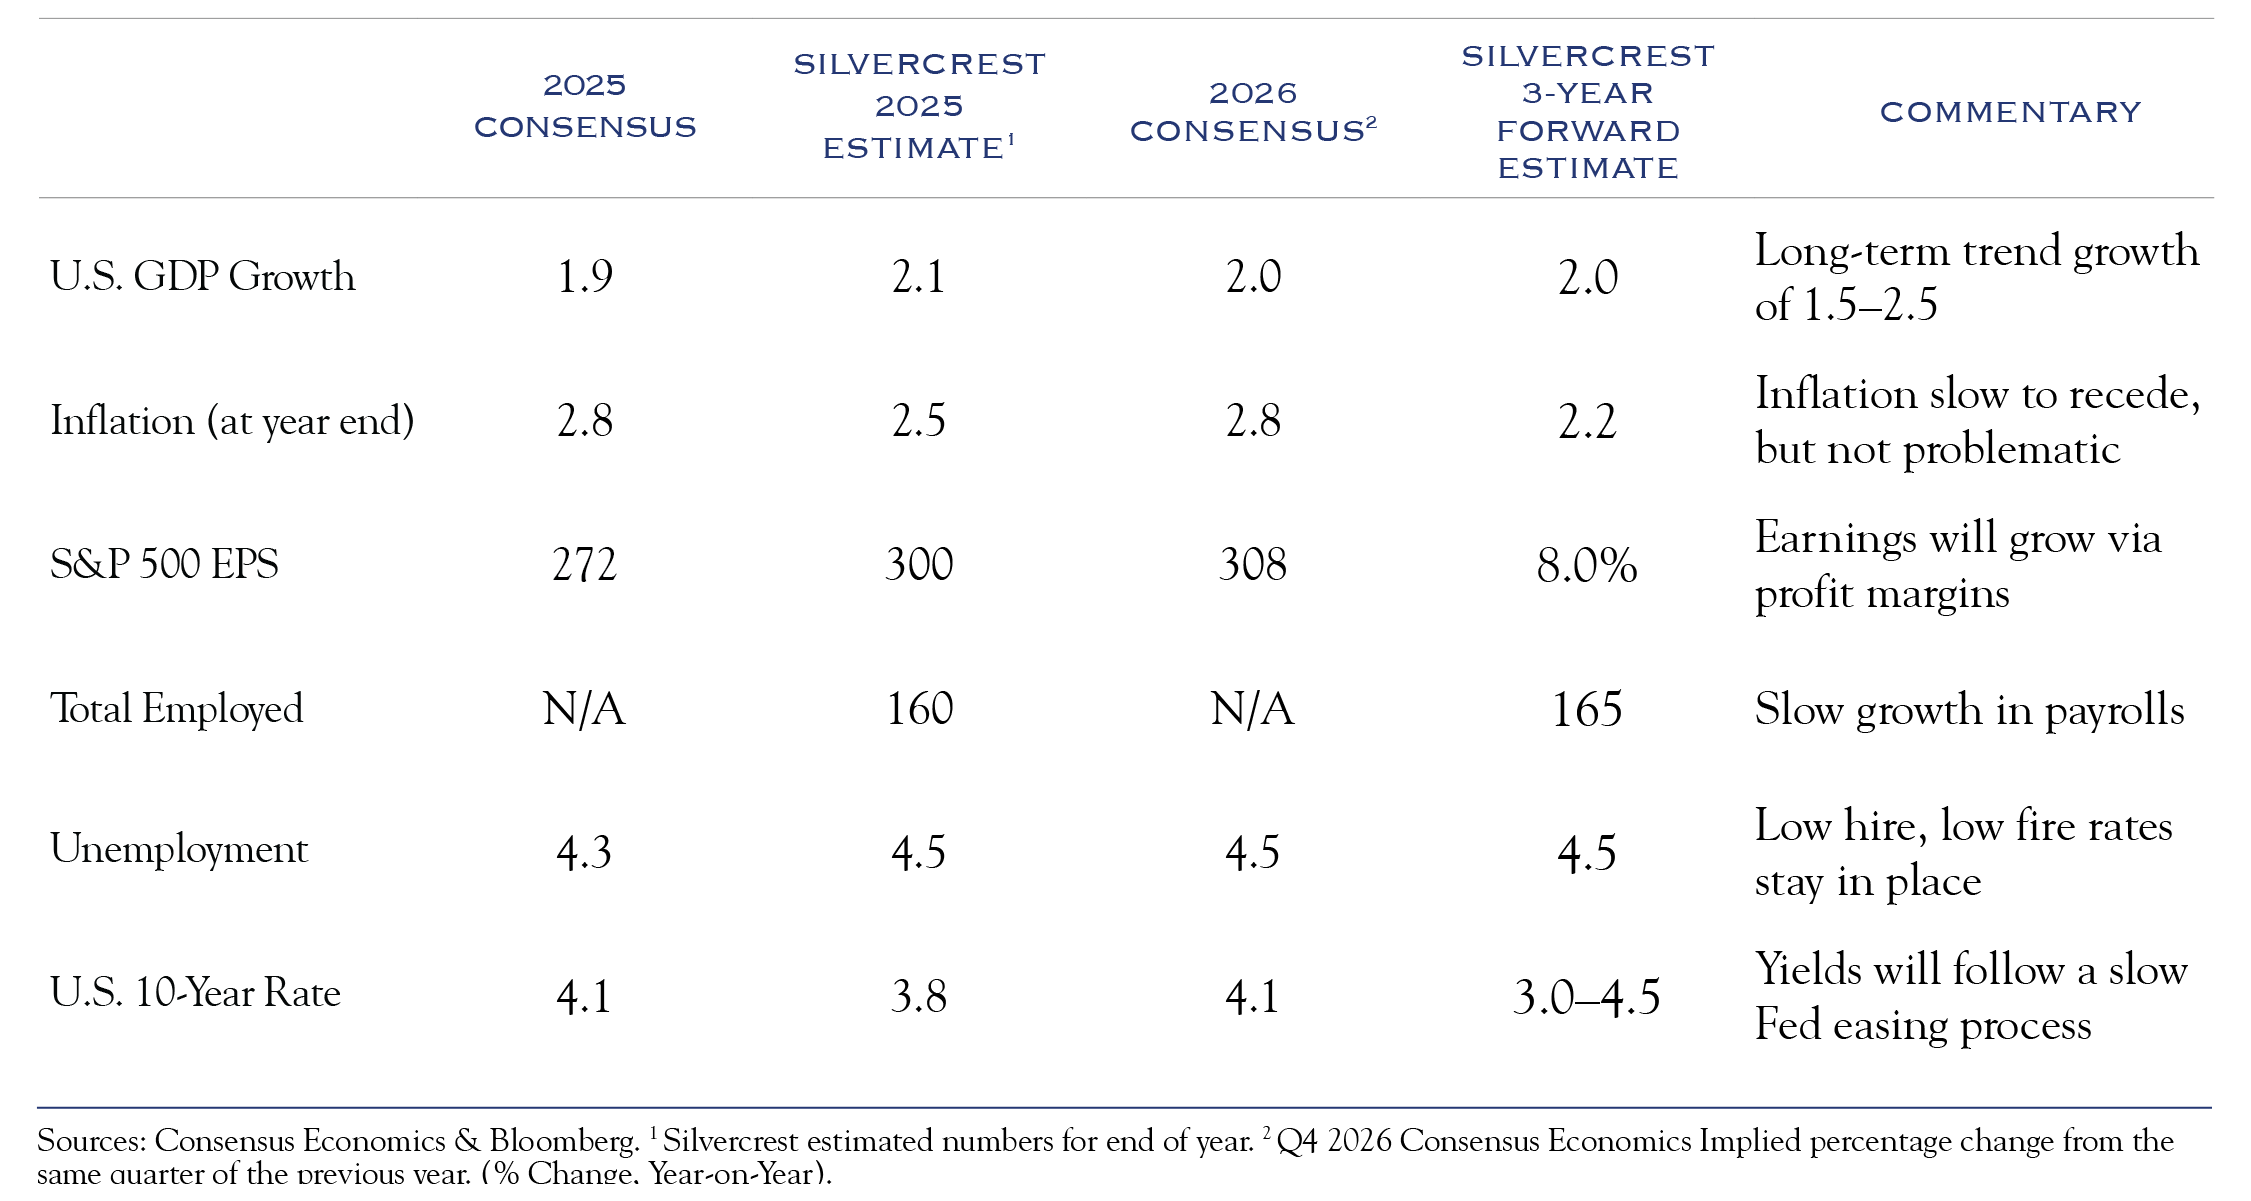
Outlook Table
Disclosures
This document has been prepared without consideration of the investment needs, objectives or financial circumstances of any investor. Before making an investment decision, investors need to consider, with or without the assistance of an investment advisor, whether the investments and strategies described or provided by Silvercrest, are appropriate, in light of their particular investment needs, objectives and financial circumstances. Furthermore, this document is for information/discussion purposes only and does not and is not intended to constitute an offer, recommendation or solicitation to conclude a transaction or the basis for any contract to purchase or sell any security, or other instrument, or for Silvercrest to enter into or arrange any type of transaction as a consequence of any information contained herein and should not be treated as giving investment advice.
This communication was not intended or written to be used, and cannot be relied upon, by any taxpayer for the purposes of avoiding any U.S. federal tax penalties. The recipient of this communication should seek advice from an independent tax advisor regarding any tax matters addressed herein based on its particular circumstances. Investments with Silvercrest are not guaranteed. Although information in this document has been obtained from sources believed to be reliable, we do not guarantee its accuracy, completeness or fairness, and it should not be relied upon as such. All opinions and estimates herein, including forecast returns, reflect our judgment on the date of this report, are subject to change without notice and involve a number of assumptions which may not prove valid.
Investments are subject to various risks, including market fluctuations, regulatory changes, counterparty risk, possible delays in repayment and loss of income and principal invested. The value of investments can fall as well as rise and you may not recover the amount originally invested at any point in time. Furthermore, substantial fluctuations of the value of the investment are possible even over short periods of time. Further, investment in international markets can be affected by a host of factors, including political or social conditions, diplomatic relations, limitations or removal of funds or assets or imposition of (or change in) exchange control or tax regulations in such markets. Additionally, investments denominated in an alternative currency will be subject to currency risk, changes in exchange rates which may have an adverse effect on the value, price or income of the investment. This document does not identify all the risks (direct and indirect) or other considerations which might be material to you when entering into a transaction. For certain investments, the terms will be exclusively subject to the detailed provisions, including risk considerations, contained in the Offering Documents. Review carefully before investing.
This publication contains forward looking statements. Forward looking statements include, but are not limited to assumptions, estimates, projections, opinions, models and hypothetical performance analysis. The forward-looking statements expressed constitute the author’s judgment as of the date of this material. Forward looking statements involve significant elements of subjective judgments and analyses and changes thereto and/or consideration of different or additional factors could have a material impact on the results indicated. Therefore, actual results may vary, perhaps materially, from the results contained herein. No representation or warranty is made by Silvercrest as to the reasonableness or completeness of such forward looking statements or to any other financial information contained herein. We assume no responsibility to advise the recipients of this document with regard to changes in our views.
This communication contains the personal opinions, as of the date set forth herein, about the securities, investments and/or economic subjects discussed by Mr. Teeter. No part of Mr. Teeter’s compensation was, is or will be related to any specific views contained in these materials. This communication is intended for information purposes only and does not recommend or solicit the purchase or sale of specific securities or investment services. Readers should not infer or assume that any securities, sectors or markets described were or will be profitable or are appropriate to meet the objectives, situation or needs of a particular individual or family, as the implementation of any financial strategy should only be made after consultation with your attorney, tax advisor and investment advisor. All material presented is compiled from sources believed to be reliable, but accuracy or completeness cannot be guaranteed.
© Silvercrest Asset Management Group LLC
Artwork featured in this publication was taken from the Silvercrest Collection. The details are as follows:
Washington’s Grand Entry into New York, from the original drawing by Alphonse Bigot; published by Thayer & Co.
The Night Council at Fort Necessity, by H.B. Hall, after the original by McNevin.
Washington Taking Command of the American Army, published by Currier & Ives.
The Tocsin of Liberty, published by Currier & Ives.
Washington Crossing the Delaware, by Illman & Sons, after the original by Emanuel Leutze.
The Minute-Men of the Revolution, published by Currier & Ives.
The Declaration of Independence, lithographed and published by N. Currier.
Washington at Valley Forge, published by N. Currier.
Surrender of Cornwallis, published by Currier & Ives.