
Starting in 2009, the S&P 500 has produced a series of positive calendar year returns. Against this backdrop, memories of market declines may have faded. A healthy memory and experience in navigating history is an important first step in understanding risk.
As the master of art and science, Leonardo da Vinci once said, “I shall do some experiments before I proceed farther, because my intention is to cite experience first…”1
One “experiment” that we will show is an examination of market data to extract a history of market declines. These bouts of volatility (to the downside) over varying time frames set the backdrop for what most investors think of as risk—either a “correction” or a “bear market”.
Against this backdrop, memories of market declines may have faded.
While a data-driven risk review of history might seem to be rather scientific and clear, risk analysis has more in common with art than it might appear. As with a painting or photograph, a seemingly clear picture of risk may elicit many interpretations. Further, methodology, data sources, time frames, market conditions and expectations will influence results. Thus, a risk calculation is merely a starting point from which to draw meaning, rather than a scientifically derived truth.
As a practical exercise, it can be helpful to evaluate the maximum amount of sustainable decline in a portfolio over a reasonable time horizon. This can be developed with a goal of understanding how much of a decline can be tolerated without impairing underlying goals for the portfolio.
In the words of Arthur Rudolph, an Apollo engineer for NASA, “You want a valve that doesn’t leak and you try everything possible to develop one. But the real world provides you with a leaky valve. You have to determine how much leaking you can tolerate.”2
For perspective, we provide a history of market declines.
First, we examine declines of 10% or worse in a month for the S&P 500, measured from month end to month end. In other words, this is when a 10% decline would be evident when reviewing a monthly statement. We perform the same analysis with 5% declines. Finally, we examine bear markets. In all cases, data is for the S&P 500 dating back to 1929.
While declines of 10% are somewhat rare, 5% declines are more common, yet the larger declines seem to become more engrained in popular memory.
Declines of 10% in a Calendar Month
A 10% decline in a single month is somewhat rare.
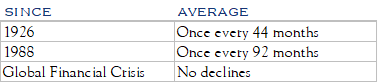
We have now gone 105 months since a -10% monthly declines in S&P 500.
Declines of 5% in a Calendar Month
A 5% decline occurs about once every year across multiple time frames.
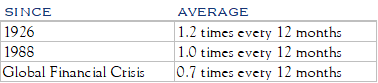
We have now gone 25 months since the -6.3% decline in August of 2015.
Source: Bloomberg
While the past will not likely repeat, being informed makes for better preparation in the form of asset allocation and awareness of possible outcomes.
We recognize that the pursuit of good long-term returns depends on the investor’s ability to accept volatility; the acceptance of short-term price volatility creates the opportunity to achieve superior returns over time.
While it is tempting to extrapolate data from this chronicle of bear markets, it is better to assume that any such attempt will provide no predictive value. However, in constructing a portfolio, which may have to withstand a bear market (or several), there is some value in understanding the profile of bear markets.
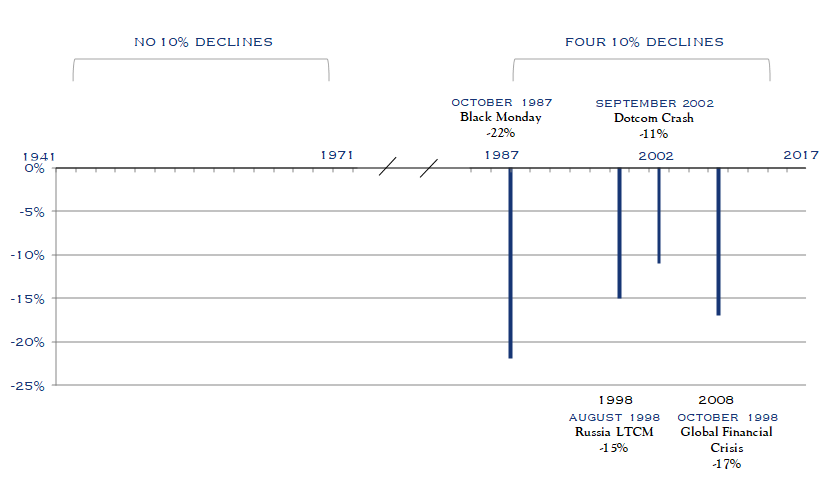
Source: Bloomberg
As illustrated above, there were no 10% monthly declines from 1941 to 1971 and in 1971, declines of 10% or more may have seemed quite rare. However, in a different 30-year period, such declines may have appeared to be much more “normal”.
Bear markets are typically defined as a decline of 20% or more. The table below shows the frequency and duration of bear markets.
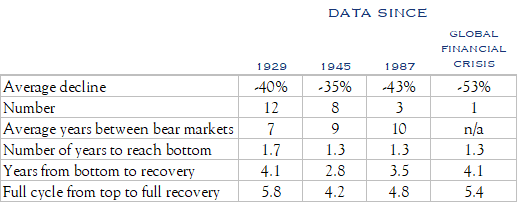
Source: Bloomberg
For instance, an investor ought to be prepared for a bear market to cause a portfolio to remain below a prior high value for several years. Also, it has been the case that a bear market can claim 50% of the equity value in a portfolio—roughly a one-third reduction in total value for a 70/30 portfolio, assuming no change in the fixed income component. Another observation is that the decline during the global financial crisis was worse than average for a bear market, though the recovery path was somewhat typical.
In the book Against the Gods: The Remarkable Story of Risk, by Peter L. Bernstein, it is noted that “The word ‘risk’ derives from the early Italian risicare, which means ‘to dare’. In this sense, risk is a choice rather than a fate.” [Bernstein’s book, published in 1996 has stood the test of time. It is a fabulous read.]
Risk calculation is merely a starting point from which to draw meaning
The level and location of risk taken in a portfolio is indeed a choice, albeit one that does not lend itself to easy measurement. After all, what looks safe today may become risky tomorrow. Clear data may become cloudy on a detailed examination. Preferences may change and risks that seemed tolerable may become intolerable as they move from theoretical to realized.
To address these complexities, a sound investment process draws on both art and science to develop the most informed view of the risks being taken. When the analysis is combined with experienced interpretation, informed judgments can be made. By undertaking a review of market declines, our goal is to inform sound portfolio construction and a level of preparedness such that a long-term perspective is maintained.
1 Leonardo Da Vinci, by Walter Isaacson.
2 Against the Gods: The Remarkable Story of Risk, by Peter L. Bernstein.
This communication contains the personal opinions, as of the date set forth herein, about the securities, investments and/or economic subjects discussed by Mr. Teeter. No part of Mr. Teeter’s compensation was, is or will be related to any specific views contained in these materials. This communication is intended for information purposes only and does not recommend or solicit the purchase or sale of specific securities or investment services. Readers should not infer or assume that any securities, sectors or markets described were or will be profitable or are appropriate to meet the objectives, situation or needs of a particular individual or family, as the implementation of any financial strategy should only be made after consultation with your attorney, tax advisor and investment advisor. All material presented is compiled from sources believed to be reliable, but accuracy or completeness cannot be guaranteed. © Silvercrest Asset Management Group LLC

