
The pervasive pandemic coupled with an ebullient economy creates a conundrum. Inflation is running hot, yet interest rates remain below pre-COVID levels. Meanwhile, the economy and earnings remain robust. The current elevated inflation readings are inconsistent with the present level of interest rates, suggesting investors do not expect price pressure to persist. Nonetheless, it is worth considering valuations in a rising rate environment. With this in mind, we review the current state of the economy and present our research on historical interest rate impact on equity valuations. We also share our outlook—which is for modest equity gains, driven primarily by continuing earnings growth, with interest rates moving modestly higher, but topping out at around 2.0%.
Pervasive Pandemic, Ebullient Economy
Case counts for the Omicron variant of COVID continue to increase, yet signs of economic activity remain strong. This is a dramatic contrast to earlier COVID waves. In fact, a decoupling of COVID and the economy is underway, as each successive wave of virus cases becomes less economically disruptive. Data from real-time sources show little reduction in activity across categories such as bank card spending, air travel, hotel, restaurant, and mobility.
The Federal Reserve Bank of New York publishes its Weekly Economic Index (WEI) highlighting weekly estimates of GDP growth for ten economic indicators. For reference, GDP growth averaged just over 2.0% from 2010 through the onset of the pandemic. Now, the WEI forecasts GDP growth closer to 7.2%.
Still, supply chain challenges are limiting growth and increasing inflationary pressures. Workplace COVID protocols, labor participation, demand surges, and congestion at major ports are among the difficulties facing businesses striving to navigate towards increased profitability.
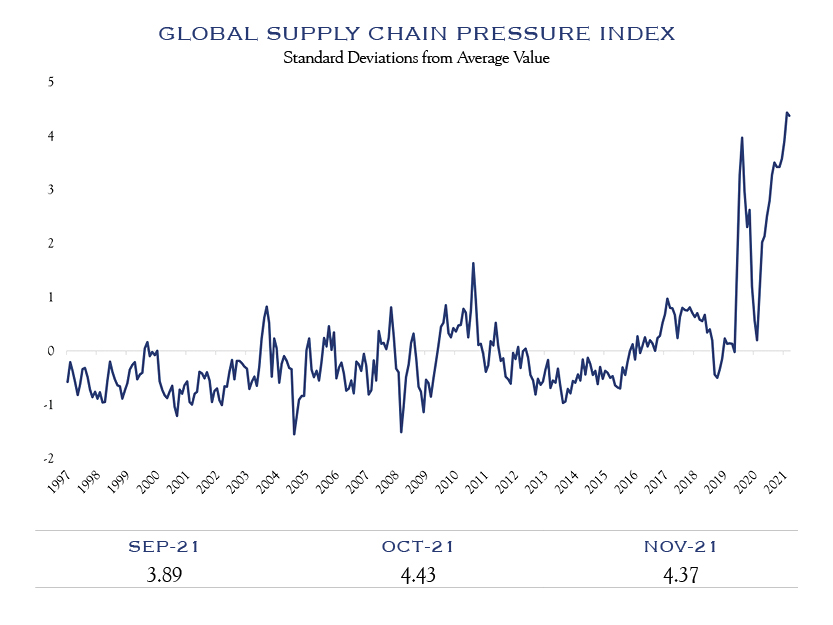
Sources: Bloomberg & Federal Reserve Bank of New York. Index scaled by its standard deviation.
As supply challenges collided with strong consumer demand, widespread price increases resulted. The most recent Consumer Price Index (CPI) reading showed prices increased by 7.0% since last year as supply-chain shock crippled supply’s ability to keep up with demand.
On the positive side, early signals point to a peak or easing of supply chain difficulties. The Institute for Supply Management’s Manufacturing Purchasing Managers Index reveals that delivery times from suppliers are decreasing along with delivery prices.
The Federal Reserve Bank of New York created a new gauge of supply chain pressure: the Global Supply Chain Pressure Index. It incorporates transportation metrics across shipping and air cargo, as well as delivery times and backlogs. The current level of stress on the supply chain is the highest measured dating back to 1997, far exceeding the disruptions seen from events such as the Japanese earthquake and nuclear disaster of 2011. Encouragingly, the latest reading showed the first decline in supply chain pressure since October 2020. It is only a blip, but like the ISM figures, it demonstrates improvement.
Margins & Productivity
The National Bureau of Economic Analysis traces the long arc of the importance of nails since 1695. (The Price of Nails Since 1695: A Window Into Economic Change, Daniel, E. Sichel, National Bureau of Economic Research.) For context, at one point, nails were about as large a portion of the U.S. economy (0.4%) as air travel or computers are today. While we may consider a nail cheap and disposable, there was a time when the cost of nails was meaningful. Several waves of productivity eventually enhanced from the production of approximately 1 nail per minute to 2,000 nails per minute. In the 1800s prices dropped in subsequent waves, ultimately resulting in a decline by a factor of 10. In the economic arena, over long periods of time, productivity and innovation typically prevail.
The primary elements predictive of earnings’ future growth are GDP growth, logistics, and productivity gains. This interplay between revenue and product costs will determine the profit margins that will be under scrutiny during earnings reporting season. As of the third quarter, companies withstood a number of obstacles and continued to post strong profit margins. Within the Russell 1000 Index, 21 of 24 industry groups of large cap companies had reported higher profit margins than the previous three-year average. Thus far, productivity gains seems to be winning the battle of COVID supply chain disruptions and cost increases.
Earnings
Analysts anticipate S&P 500 Index earnings to be $220 for 2021 and $242 for 2022—a growth rate of 9.0%. Our view is slightly less sanguine, as we expect sales growth to be a tad slower than consensus and we foresee costs exerting a bit more pressure. However, we do acknowledge that a quick resolution to the unpredictability of COVID could create further earnings power and upside above our forecast of $235, or 7.0% growth in 2022 earnings.
Valuation
Both sentiment and interest rates play important roles in determining valuation.
Effervescent sentiment is a frequent indication that valuations are near a top. A research paper recently outlined the linkages between the characteristics of music played on Spotify, national sentiment, and market returns, suggesting that sentiment influences prices in the short term. Presently, traditional metrics of sentiment are sending mixed signals. Bullish readings for the American Association of Individual Investors remain low at roughly 30%, which is well below the mid-40ss level of November—prior to Omicron. The NAAIM Exposure Index also shows equity exposure levels lower than prior months. The San Francisco Fed’s News Sentiment Index has similarly declined since the fall. Should we see improving sentiment in coming quarters, it could further support elevated equity valuations.
Word searches in Google Trends and earnings transcripts can also indicate prevailing sentiment or topics of interest. For example, the use of the term “COVID” on earnings calls of S&P 500 companies revealed a sharp decline in early 2021 that continues to decline. This suggests the waning importance of COVID to both company managements and their investors.
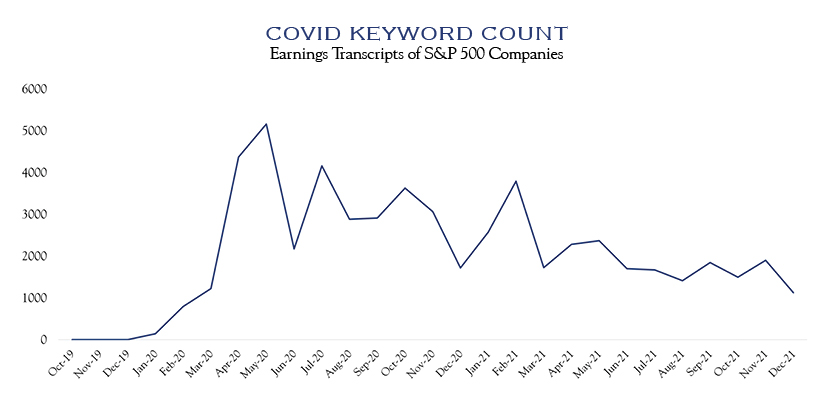
Source: Bloomberg
Interest rates are a critical driver of equity valuations, as increased bond rates tend to make equities less attractive—especially as rates increase to 3.5% and higher. This reality garners more attention as the Federal Reserve communicates a growing focus on combatting inflation—initially through the end of Open Market Committee bond purchases and eventual moves to increase policy rates. This led to increased interest rates for U.S. Treasury 10 Year Notes.
Current rates around 1.7% are comparable to those seen earlier in 2021, and below pre-pandemic levels. Our view is that rates were due for an increase as COVID fears eased. That upward pressure on rates, along with Fed policy guidance will compete with buying attention from pension funds, foreign buyers, and insurance companies for whom rates above 1.5% are appealing. Overall, we expect interest rates to move higher, capping out around 2.0% at some point in 2022.
Valuation levels are steered by interest rates and analysts often ignore important interest rate effects when conducting historical comparisons of Price/Earnings (“PE”) ratios. There are two major asset classes: equities and bonds; when bonds offers a rate of return well below historical averages, it stands to reason that equities will have higher valuations. Further, when considering future cash flows, the discount rate plays a critical role in the calculation of the present value of a security. Simple math implies that higher interest rates are detrimental to valuation. The important question – how much?
Into the Zone
Our view remains that Price/Earnings (“PE”) levels from 18-22 are well-supported given the current interest rate environment. In addition to rates, valuation levels are affected by sentiment, domestic policy, geopolitical risks, and other factors.
Long-term averages for PEs are in the high teens, and recent periods are anchored around 20. We conducted research examining the historical relationship between PE ranges and interest rates. The conclusion is that interest rates play an important role in setting the foundation of valuation, and when rates move to extreme levels, PEs will do the same. For example, when PEs are between 10 to 15, the average interest rate has been 7.5%. When PEs are below 10, interest rates have averaged above 10%. However, across a wide range of PE multiples from 15-30, interest rates have averaged 4.8%. Rates between 4.0 and 5 .0% have supported a wide range of PEs. Thus, we anticipate that an increase to 2.0% is consistent with expectations of stable equity valuation multiples.
We expect multiples to reside at the lower end of the 20-25 range in coming years. Below is a distribution of interest rates during prior quarters when multiples were in that zone.
As shown above, if rates return to the range of 1.5% to 3.0% where they traded in the years prior to COVID, those levels should not pose as a problem for PE ratios, since PEs of 20 to 25 have often coexisted with interest rates ranging from 1.0% to as high as 8.0%. Thus, while a rise in rates would likely contribute some downward pressure on PEs, moderate rate increases are unlikely to trigger significantly lower equity multiples.
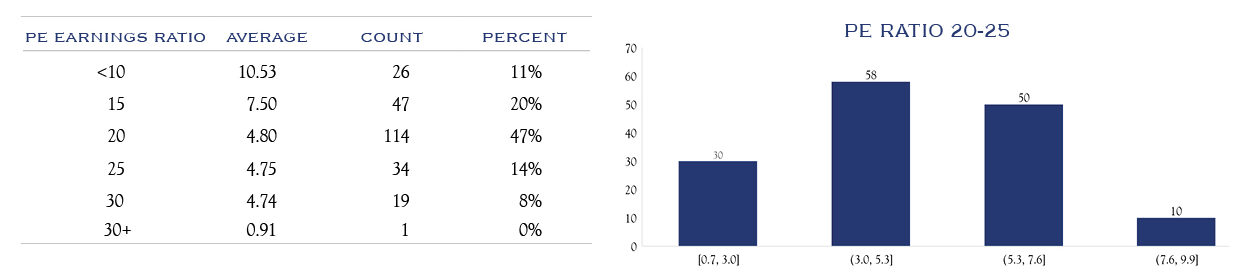
Source: Bloomberg
The great conundrum of the past year has been that the rapid rise in inflation has not been met with an increase in interest rates. There are two contributing factors that help explain this mystery:
- Rates above 1.5% are appealing to foreign buyers whose domestic rates are even lower and to pension funds attempting to reduce risk by allocating to bonds after becoming more fully funded as a result of equity market advances.
- COVID risks have prompted allocation to bonds by investors reducing risk in portfolios during the pandemic. This pattern can be seen in the graph below where rates have risen in response to each decline in COVID cases across the various waves.
It is possible that some of the recent rate increases are related to an anticipated peak of the Omicron wave. In comparison to pre-COVID rates and the magnitude of increase in each wave, we estimate that rates could approach 2.0% if COVID risks largely disappear.
Fed policy has evolved, with the Fed moving to more quickly taper, and end, its direct support of the bond market through its purchases. Fed Funds Futures indicate an initial rate hike in March 2022, with three hikes in total throughout the year. Our view is that the path is likely to slow, especially since inflation and the economy are likely to be cooling in the mid part of the year. Overall, we expect interest rates on the ten-year will move towards 2.0% and spend much of the year in a range of 1.50% to 2.25%.
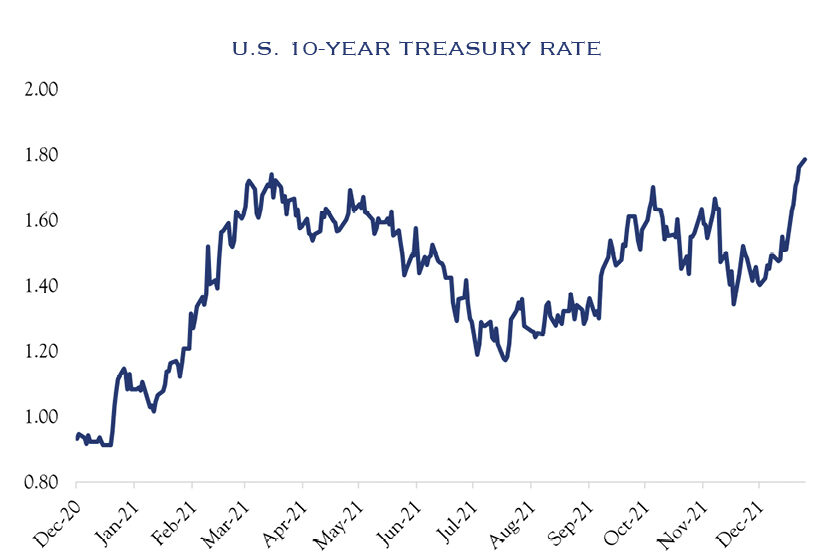
Source: Bloomberg
Outlook
Even though we have a modestly optimistic outlook for equity returns, it is important to acknowledge that a market correction generally may emerge without predictable reason. There is no shortage of concerns at present, whether geopolitical, pandemic-related, or related to fiscal and monetary policy. Economic and political transitions can be difficult and often lead to stock market volatility.
Normal market declines of less than 15% occur often and pass quickly. Declines greater than 15% while less common, occur on average once every five years. Of these declines, the median recovery time from peak to trough is about 11 months, followed by an additional 12 months to recover to prior highs, such that the “typical” time underwater is roughly 23 months—less than two years! Nothing is ever typical with market declines, but it is worth keeping in mind that a longer time horizon allows for significant decline and recovery, as markets eventually return to the long-term trend line of corporate profit growth thanks to the hard work and ingenuity of entrepreneurial business managers
Our outlook is based on an expectation of interest rates that are modestly higher, valuation levels that remain solid, and earnings that increase at a slightly less than consensus 7%.
Over the past fifty years, corporate profits in the United States (a reasonable proxy for equity earnings) have risen at a 7.1% annualized rate. For many years efficiencies allowed large cap equities to generate earnings above that long-term trend. Looking out over our forecast horizon of the next three years, while economic growth should be supportive of higher-than-average gains, we estimate that cost pressures (especially wages) will tug at margins and bring earnings to a slightly more modest level. Nevertheless, despite rate hikes, inflation fears, Washington-politics, and COVID among other threats, we expect that sentiment will improve, further supporting equity valuations.
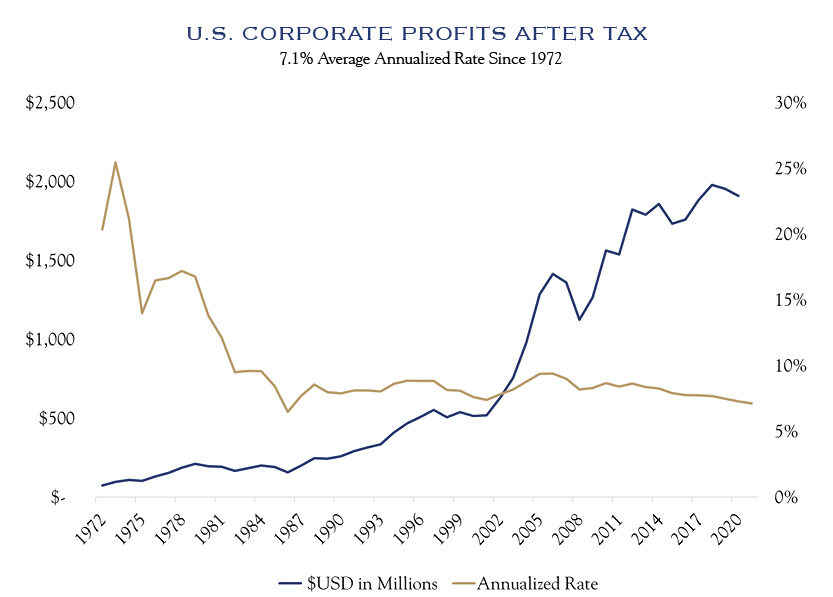
Source: U.S. Bureau of Economic Analysis (BEA)
With a choppy outlook for interest rates, careful bottom-up credit selection will be essential to success in fixed income.
Small cap equities could see continued gains from stock selection relative to other areas of the equity market, as focus is placed on domestic infrastructure spending, inventory rebuilding, and jobs on-shored back to the United States. This environment is one in which strategic corporate management will trump investment-style factors. We continue to think that bottom-up stock selection remains the key to success as companies continue to navigate a myriad of challenges.
This communication contains the personal opinions, as of the date set forth herein, about the securities, investments and/or economic subjects discussed by Mr. Teeter. No part of Mr. Teeter’s compensation was, is or will be related to any specific views contained in these materials. This communication is intended for information purposes only and does not recommend or solicit the purchase or sale of specific securities or investment services. Readers should not infer or assume that any securities, sectors or markets described were or will be profitable or are appropriate to meet the objectives, situation or needs of a particular individual or family, as the implementation of any financial strategy should only be made after consultation with your attorney, tax advisor and investment advisor. All material presented is compiled from sources believed to be reliable, but accuracy or completeness cannot be guaranteed. © Silvercrest Asset Management Group LLC

