
“Neither a lender nor a borrower be. Do not forget: stay out of debt.”- Polonius’ advice from “Hamlet”, as sung on “Gilligan’s Island”
“Ronald Reagan proved that deficits don’t matter.”- Vice President Dick Cheney, 2004
Equity markets—in the U.S. and overseas—were off to the races as the year began, buoyed by excitement over tax cuts and by strong economic data. But then second thoughts quickly set in, pulling U.S. shares into a double-dip correction that may have yet to hit bottom. The worries that drove that downturn are, at their heart, rooted in two closely related phenomena that have been salient features of the U.S. economy for decades: the budget deficit and the trade deficit. Initial enthusiasm over the positive impact of tax cuts on growth and profits soon gave way to concern that wider budget deficits could trigger inflation and rising interest rates. And President Trump’s determination to slash the trade deficit, which he sees as a major obstacle to U.S. growth, has given rise to fears of a “trade war” that could end up harming the economy.
The “twin deficits” pose a genuine challenge to the future of the U.S. economy—but how and why they do, and the relationship between them is often profoundly misunderstood. Those misunderstandings can rattle markets, but can also create opportunity for investors with more accurate insight into the dynamics affecting the economy. With U.S. shares at their lowest quarter-end valuations in nearly three years, yet little sign—in our view—that either inflation or recession is an immediate danger, we see a chance for active portfolio management to show its true worth.
Do Deficits Matter?
Large federal budget deficits have become a fact of American life, and a perennial focus of criticism from whichever party is out of power. There is considerable debate, however, over whether they have truly had much negative impact on the economy. Large budget deficits—at home and abroad—have often not triggered either the inflation or rising interest rates that debt vigilantes predict. A closer look, however, reveals the consequences may not be the ones predicted, but are real nonetheless. An open economy, like the U.S., can avoid a “credit crunch” by financing its budget deficits with capital from abroad, but the result has been large trade deficits.
Few moments capture the passion and perplexity surrounding the U.S. budget deficit better than the 1984 presidential election, when Democratic nominee Walter Mondale made it a focal point of his campaign. Under President Reagan, a combination of tax cuts, ramped-up military spending, and a painful recession had widened the gap between spending and revenue from 2.5% of GDP to nearly 6% the previous year, the highest since World War II. With the 10-year Treasury rate well into double digits, interest payments as a share of total federal spending were in the process of shooting from 7% to over 15% by the mid-1990s. Mondale promised to raise taxes to avoid catastrophe—and was defeated in a historic landslide. GDP growth hit +7.3% that year, and chugged along above +3% growth for the next five consecutive years. Budget deficits didn’t seem to matter—either to voters or the economy.
Mondale’s Cassandra-like warnings were to be repeated by both Republicans and Democrats in the decades to follow—and were not entirely without foundation. Though the economist John Maynard Keynes, in the 1930s, argued that running a government budget deficit during a recession could kickstart economic growth—“prime the pump”—by putting otherwise idle resources to work, he never advocated running chronic deficits, in good times and bad. When Keynes’ overzealous disciples pushed deficit spending—on the Vietnam War and Great Society social programs—in the 1960s, at a time when the U.S. was already at full employment, they over-stimulated the economy and helped set off the inflation that plagued the 1970s.
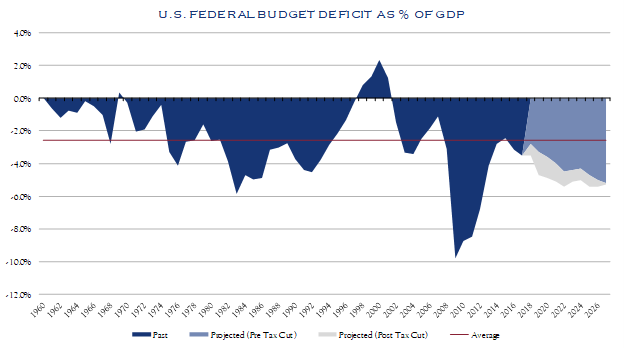
Source: Federal Reserve, CBO
Those budget deficits, which peaked at 2.8% of GDP in 1968, were modest compared to what followed. The federal budget deficit hit 9.8% of GDP in 2009 and stands at 3.5% today. Since 1980, the federal government’s public debt as a percentage of GDP has steadily risen from 31% to 104% today, yet the economic impact has somehow been very different. Inflation has remained low, and the 10-year Treasury rate steadily fell to its lowest level in history by mid-2016. Even as the debt has grown, the share of federal outlays going to make interest payments has also declined, back to below 7%.
In response, one school of thought called Modern Monetary Theory (MMT) contends that because the U.S. government issues its own fiat currency, the size of the federal debt is essentially irrelevant. When the Treasury issues bonds, they argue, it creates new private assets, essentially funding itself. It can never go bankrupt because the claims on it are in a currency it creates. Adherents of MMT point to Japan, where public debt to GDP has reached 253%, yet the rate on its 10-year sovereign bond is virtually zero. In recent years, in fact, Japan’s central bank has been able to almost fully monetize that public debt (buying it all back by issuing money) with only the slightest whiff of inflation.
MMT advocates are correct when it comes to accounting: a liability always creates a corresponding asset. What accounting doesn’t tell you is how “good” that asset is. The government issuing a bond creates a claim on value, but it doesn’t actually create anything of value—the real value lies in the goods and services people produce to meet other people’s wants and needs. Government spending can, of course, create public goods and services that people do want. But unless there are unemployed resources lying around idle, it will have to compete with other would-be producers—for labor, for material inputs, for capital.
With the unemployment rate at 4.1% and growing reports of tighter supply chains and lengthening order backlogs, it looks like the U.S. economy might be nearing those resource constraints right now. That’s why markets began to worry that the tax cuts passed in December—which are projected to add $1.5 trillion to the budget deficit over the next 10 years—could over-stimulate the U.S. economy, sparking inflation and a more assertive Fed response. Many worry the fact that the Fed has stopped buying new bonds—as it unwinds its $4.5 trillion QE holdings—at exactly the time the U.S. is issuing so much more debt, will accentuate the “crowding out” effect on other investment and further push up interest rates.
There’s another way this could play out, though. In an economy open to foreign trade and investment, such as the U.S., even a modest rise in interest rates could attract capital inflows from abroad to fund the additional debt. The inflow of capital is matched, however, by an outflow of funds via a trade deficit. That’s exactly what happened in the 1980s; rather than pushing up interest rates, bigger budget deficits pushed up the Dollar—by over 50% on a trade-weighted basis—and widened the trade deficit from 0.5% to nearly 3% of GDP. Budget deficits did have an impact on the U.S. economy, though not the one expected. Domestic demand was able to outstrip domestic supply by drawing on foreign financing and foreign output. The budget deficit and the trade deficit are linked, which is why they are called “twin” deficits.
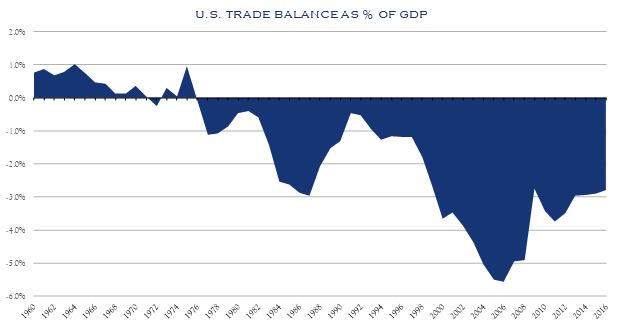
Source: World Bank
Borrowed Time
One of the biggest misconceptions out there is that trade deficits, or surpluses, are a function of “competitiveness”—either due to natural advantages (cheaper labor) or artificial ones (subsidies, stolen technology). In fact, trade imbalances are a function of savings—choices whether to borrow or to lend. Which is the better choice depends on how productively the proceeds will be used. Borrowing money to invest in the future can be a good thing, but in the case of the U.S. right now, there’s reason to be concerned that we are borrowing—and running “twin deficits”—in order to consume beyond our means, rather than boost future output. That’s a potential problem, one that policies designed to “hit back” against unfair trade practices won’t really fix.
As far back as 1817, the economist David Ricardo pointed out that the optimal basis for trade is comparative, not absolute, advantage. Even if a country is better at everything, it should export what it is best at and import what it is less better at. Having an across-the-board advantage does not imply that it makes good economic sense to produce everything yourself, much less to export more than you import in return. There’s no inherent reason why a country that earns more can’t spend more on either a higher standard of living, or investments in even greater output.
Trade surpluses take place when a country chooses to spend less than it produces—when it has excess savings, beyond its domestic need for credit. It lends that excess savings abroad, financing another country’s ability to spend more than it produces and, by running a trade deficit, purchase the lender’s excess production. Fundamentally, trade imbalances arise not from competitive advantage, but from choices about how much to save and where that savings should be deployed—at home or abroad.
National savings, in this context, doesn’t just mean household savings, but also the government’s budget balance. Running a budget deficit reduces national savings, a shortfall that, as we’ve shown, may imply a trade deficit. The relationship isn’t exact, because it also depends on consumers’ savings rate and domestic investment levels. In Japan, the nation’s inordinately high household savings rate has usually been sufficient to offset its budget deficits, while still running a trade surplus. But for the U.S., with a much lower personal savings rate, large and persistent budget deficits have been reflected—at least over the long-term—in similarly large and persistent trade deficits.
Should we be concerned? Is it better to run trade surpluses or deficits? This is like asking whether it is better to be a lender or a borrower: it depends on where the best returns are to be found. Throughout the 19th Century, the U.S. ran a chronic trade deficit, particularly with Britain. The excess savings spun off by Britain’s industrial revolution were invested in developing the American economy, generating better returns than they would have back home, while creating a market for British-made goods. It was a win-win arrangement for Americans to borrow and Britain to lend. In contrast, when the introduction of the Euro encouraged German savers to fund trade surpluses with Greece, it was lose-lose: the Greeks ended up so deep in debt, there was no possible way they could pay the Germans back in full.
Like a business taking out a loan, or a student borrowing for a college education, the ability to repay—or indefinitely service—a debt depends to how productively the funds are used. If the borrower just throws a party with the money and does nothing to enhance future earnings, additional debt will close off options, rather than open them.
Republicans and Democrats disagree about what policies would prove better at boosting productivity and growth—tax cuts to give more room for private initiative and investment, or spending on public resources like infrastructure or education. It’s a debate worth having, but one that’s increasingly pushed to the margin. Fierce as the latest legislative battle over tax cuts may have been, as the chart on page 2 shows, they add only incrementally to budget deficits that are already well above their long-term average and were expected to grow to 5.2% by 2027.
The primary driver of these deficits is entitlement spending, which is consumption, not investment. In our 3Q17 note, we observed that: In the 1960s, the federal government spent $3 on productivity-boosting public investments (in infrastructure or scientific research) for every $1 on more consumption-oriented entitlements. Today, that ratio has flipped to $1 in investments for every $3 on entitlements.
The shift strongly suggests that rising debt levels are propping up our standard of living, above and beyond what we produce, without improving our ability to produce more in the future.
By allowing foreign financing—and foreign output—to fill the gap, we have been able to avoid some of the more immediate negative consequences for our economy. The longer-term consequences, however, are potentially just as serious. First, it has either allowed or encouraged other countries to over-save, suppressing demand that might have been met in a more balanced and sustainable way by U.S. output. Second, as a result, it risks undermining our future productive capacity by “hollowing out” industries and skill sets that aren’t easily replaced, once lost. The latter concern is the great fear that has convinced President Trump and many of his advisors to impose tariffs—and risk retaliation—to protect such industries and demand better access to markets abroad. But such measures, aimed at tilting “competitiveness” back in our favor, actually do little or nothing to alter the real underlying reasons for the chronic U.S. trade deficit: patterns of consumption, savings, and investment, both at home and abroad. President Trump’s larger budget deficits will, if anything, tend to widen the trade deficit, while combative protectionism risks unraveling many of the productive benefits that come from trade, balanced or not.
On the Bright Side
It’s this worry—the risk of descending into a trade war—that has hung like a lengthening shadow over markets, even as concerns over inflation and rising interest rates have subsided. The S&P 500 fell −2.7% in March, bringing its performance back into negative territory (−1.2%) for the year. Global equity markets—in Asia, Europe, and elsewhere—also felt the chill, with the MSCI World Index falling −1.7% in March, down −1.1% on the year. The market’s concerns are not unfounded. The wide-ranging trade sanctions the President has put forward could harm the economy in several ways. First, they could cause an inflationary price shock, both in key inputs and consumer goods, at a point in the business cycle where it would be least welcome. Second, they could invite painful retaliation against trade-dependent sectors, like agriculture, IT and aircraft. Third, they could undermine the global trade rules that—however imperfect—have opened markets and opportunities for companies around the world.
That said, it’s important for investors to keep in mind the difference between words and actions. President Trump has repeatedly threatened to quit NAFTA, but despite Canada and Mexico rebuffing his ultimatum, he agreed to extend negotiations. His steel and aluminum tariffs, when first announced, applied to everyone, sparking fears—and more threats—of a bruising trade battle with the European Union. Then quietly, over the next few weeks, exemptions were granted to partners accounting for a majority of U.S. steel imports (including the E.U.), mitigating most—though not all—of the sanctions’ immediate negative impact. With South Korea, the President showed himself willing to back off both steel tariffs and threats to cancel our bilateral free trade agreement in return for fairly modest concessions. And most of his proposed tariffs aimed at China—along with the stiff tariffs China announced in retaliation—remain just that: proposals, with time to negotiate before they are enacted. No question, the President could choose to go down a very bad path on trade, one that could change our market and economic outlook significantly for the worse. Whether he actually does—or whether his threats prod other countries to rethink some of their own protectionist policies—remains to be seen.
Meanwhile, let’s not forget, the U.S. economy continues to show encouraging growth momentum. The latest numbers may not be quite as full-speed-ahead as they were at the very start of the year, but there is little sign of either a take-off in inflation, or an impending recession. The Atlanta Fed projects that GDP grew by +1.9% in the first quarter, the New York Fed by +2.8%. Industrial production in February was up +4.3% from a year ago, its highest year-on-year rate of growth in six years. February factory orders were up an impressive +7.1% from a year before, with orders for core capital goods—a key indicator of business investment—up +7.7%. Both the ISM Manufacturing and Non-Manufacturing indices, based on purchasing manager surveys, remain in solid expansion territory in March—after the manufacturing gauge hit a 14-year high in February—buoyed by a strong stream of new orders.
U.S. consumer confidence is very strong: the University of Michigan’s survey hit a 14-year high in early March, while the Conference Board’s gauge hit an 18-year high in February. One key factor is jobs: while the +103,000 jobs gained in March fell short of expectations, the three-month average of +202,000 so far this year is above the average of the past two years, and initial jobless claims remain at a 44-year low. While retail sales have declined slightly for the past three months in a row, February sales were still up a respectable +4.0% from a year ago. Consumer spending overall was up +4.7%, despite a somewhat welcome rebound in the personal savings rate back to 3.4%, after the cycle low of 2.4% it fell to in December. Auto sales also rebounded in March to an annual rate of 17.5 million vehicles per year, after a soft start to the year. The housing market, however, has cooled, with new and existing home sales barely up year-on-year, and new starts down −4.0% in February, from a year ago. The housing market seems stuck in a stop-and-go cycle, unable to gain momentum for more than a few quarters at a time.
While the ISM purchasing manager surveys continue to report gathering price pressure across multiple sectors, headline inflation figures show little cause for alarm. Consumer prices (CPI) are up +2.3% from a year ago, slightly above the Fed’s 2% target, but core CPI (excluding food and energy) is still +1.9%. Headline and core PCE, the Fed’s preferred inflation index, are both below 2%. Meanwhile, hourly wage growth—which helped trigger February’s stock market sell-off when it hit +2.9% y/y—has relaxed back to +2.7%. The inflation worries that provided the initial catalyst for the market correction were premature, which may account for why the 10-year Treasury yield remains below 3%.
The most underrated story recently has been corporate profit growth—which should get a further boost this year from tax cuts. Operating earnings per share (EPS) for the S&P 500 rose +17.2% last year, nearly keeping pace with the +19.4% rise in share prices. If quarterly earnings hit consensus expectations for Q1, they will rise a further +5%, up +23% year-on-year. That would pull the trailing 12-month P/E ratio down from 21.5x at the start of the year and 23.0x at the market’s January peak to 20.0x—the lowest quarter-end share valuations since 2015. Unless you think the U.S. economy is about to fall off the rails—and we don’t—that suggests a selective buying opportunity.
The market’s ups and downs lately may feel unnerving, but far from being abnormal, they are actually a return to normality, after an unusually placid two years. Average annualized realized volatility for the S&P 500 this year has been 20%, only a bit above its long-term average of 19%, compared with 13% in 2016 and 7% in 2017. Before February, the market went two full years without a −10% correction. Such corrections normally occur an average of once a year. Meanwhile, lower equity valuations have pushed the Equity Risk Premium (ERP) back to 5.2% (well above its long-term average of 4.1%), suggesting that investors can expect to be well rewarded for stomaching equity risk, compared with much lower returns on Treasury bonds.
The U.S. economy faces real challenges, arising in part from its “twin” deficits, though it has the potential to tackle them through wise policies that unlock productivity gains at home and consumer demand abroad. The risk of misguided policies is also real, but the economy is in a better place than recent market jitters suggest. The market, focused on the downside, is valued at its lowest quarter-end level in nearly three years. We think it’s leaving some upside on the table.
This communication contains the personal opinions, as of the date set forth herein, about the securities, investments and/or economic subjects discussed by Mr. Chovanec. No part of Mr. Chovanec’s compensation was, is or will be related to any specific views contained in these materials. This communication is intended for information purposes only and does not recommend or solicit the purchase or sale of specific securities or investment services. Readers should not infer or assume that any securities, sectors or markets described were or will be profitable or are appropriate to meet the objectives, situation or needs of a particular individual or family, as the implementation of any financial strategy should only be made after consultation with your attorney, tax advisor and investment advisor. All material presented is compiled from sources believed to be reliable, but accuracy or completeness cannot be guaranteed. © Silvercrest Asset Management Group LLC

