
COVID-19 dominates our days in an all-consuming manner, more so than the 2008 financial crisis and perhaps exceeded only by war. The recent market highs feel like ancient history as the arrival of this state of affairs was swift and the turn from peak to bear was the fastest ever recorded. That lightning quick move lower is one example of a string of biggest and worst statistics from the first quarter. The title of a recent book by Erik Larson on Churchill and the war—The Splendid and the Vile—captures the wide range of emotions felt across the first three months of 2020. No doubt more vile than splendor, but within the numerous acts of destruction caused by COVID-19, there have been moments of splendor in the amazing examples of American ingenuity and human compassion shown in the battle with the virus.
The first quarter of 2020 will occupy a prominent spot in history. COVID-19 is the worst pandemic in the last 50, if not 100, years and financial statistics during this time blasted the normal-distribution bell curve out of existence and created outliers of epic proportion, all occurring at warp speed.
“Nourish your hopes, but do not overlook realities.” – Sir Winston Churchill
We follow Churchill’s advice below, taking a brief look back at the wreckage wrought by the vile virus before we review economic projections and signposts to monitor on the path to stabilization and recovery.
A Record-Breaking Quarter
Jobs Vanish
April 2: Increase in jobless claims was the largest ever
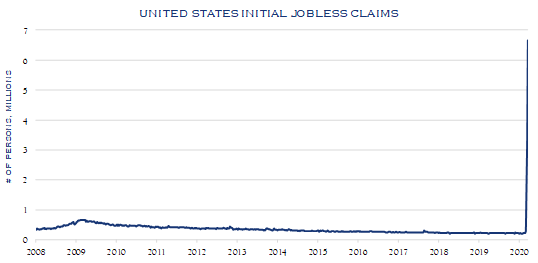
Source: U.S. Department of Labor
Complete Stoppage of Restaurant Activity
From March 1 to March 18, NYC restaurant reservations changed from normal to −100% per OpenTable
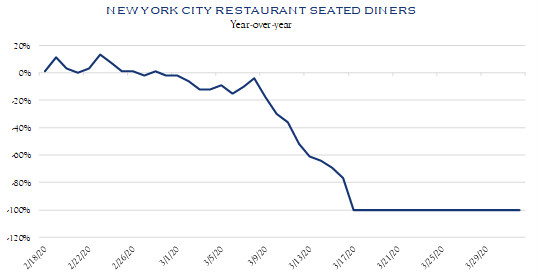
Source: OpenTable
Most Volatile Market
Highest ever sustained reading in the volatility index (“VIX”)
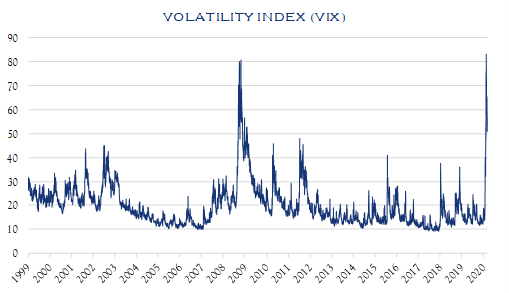
Source: CBOE/Macrobond
Fastest Bear Market Ever
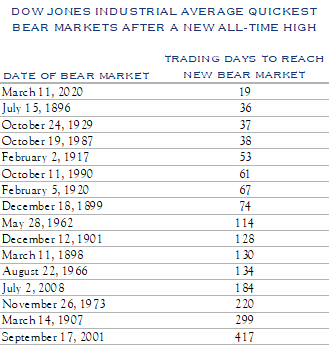
Source: LPL Research, FactSet
Best Week in 82 Years
Following the quickest move ever to a bear market (as defined by a 20% decline), stocks promptly rallied and produced the single largest positive weekly return since 1938. While stocks remain well below peak levels, this type of extremely fast movement, both up and down, demonstrate why market timing remains a futile exercise.
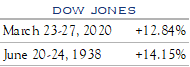
Source: Bloomberg
Stocks & Bonds, Off the Worst
Markets deteriorated quickly, with credit spreads widening and stocks declining in rapid fashion. Each have recovered a bit, and while far from their best levels, the table below provides some perspective on best and worst readings during the quarter. Aided largely by the best week mentioned above, stocks have surprisingly re-traced about 20% of their decline, while credit spreads have re-traced about 26% of their widening.
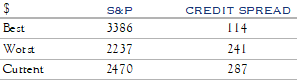
Source: S&P 500, Credit Index Option Adjusted Spread
Congressional Stimulus
On March 27th, Congress passed the largest economic stimulus package in history. While the details are worthy of debate, and execution is of the essence, there is no doubting the size of this stimulus package. As indicated in the chart below, the direct stimulus of $2.2 trillion is the equivalent of 10% of GDP, while the full benefit, inclusive of additional lending, is over 25% of GDP.
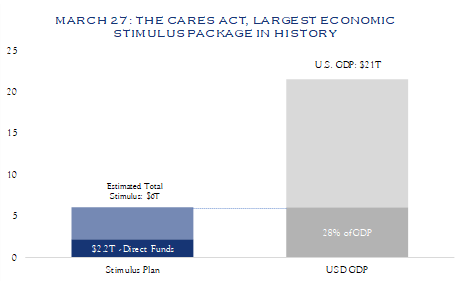
Source: The White House/Bloomberg
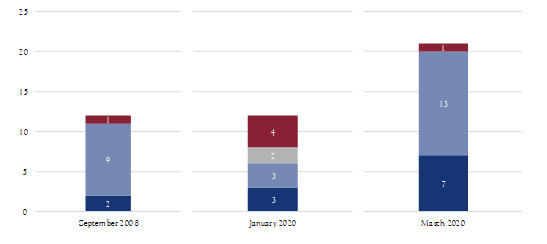
Federal Reserve Support
The Federal Reserve made perhaps the most significant and swift actions in its history in March—taking approximately 20 actions, press releases and other steps in support of market stability, liquidity, and lending activity. This compares with 1–2 actions in recent “normal” months and approximately 12 actions taken during September of 2008. To be sure, this is an imperfect comparison. The takeaway is that the Fed is moving with unprecedented speed and acting with significant force to provide liquidity in markets and support lending “bridges” to assist companies through the economic stoppage.
![]()
Source: Federal Reserve
Labor Market Divergences
The economic stoppage in coming weeks and months and the recovery beyond will bring an extraordinarily wide range of outcomes in employment across industries. 152.5 million Americans were employed in February, nearly four million more than in February of the prior year. Nearly 10 million filed unemployment claims in recent weeks.
Below is a simple table showing employment in several industries—some of which are very disrupted and some of which are likely less disrupted.
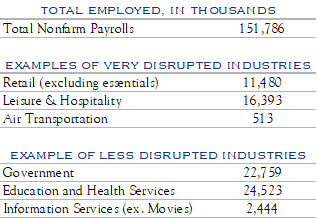
As of March 2020. Source: BLS
By nature of economic stoppage, consumption patterns have changed or been eliminated in the retail, leisure & hospitality, and air transportation industries. Economic activity and employment continued in the government, education, health services, and most information services industries.
In spite of staggeringly bad jobless claims, several large corporations announced massive hiring plans. Amazon and CVS were two cited by Vice President Mike Pence. These large shifts occur over time. Behaviors often change in times of crisis, and while the disrupted industries will re-open, it is too soon to know how quickly that will happen and what level of employment will ultimately prevail.
Balance Sheet Divergences
The strength of corporate balance sheets also helps explain a divergence between companies. Within the S&P 500, companies with the best balance sheets are those which have net cash positions (i.e. more cash than debt outstanding) and generate enough free cash flow to cover years of interest expense. while other companies have more challenged balance sheets. This divergence is shown in the table below for highest and lowest in the S&P, ranked on one metric.
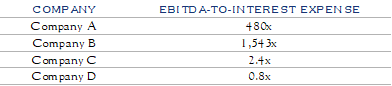
Source: Bloomberg
Large differences also exist in financial health as captured by government debt to GDP for select countries in the table below.
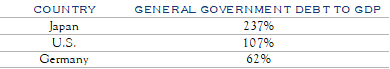
Source: IMF Data for 2018
Economic Projections
COVID-19’s impact will wane and the economy and markets will begin to recover. Current government projections show peak severity in mid-April and cases declining throughout May, reaching low levels in June. There will be, however, significant diversion between the timelines of the outbreak in different cities of our vast country.
Normally, Silvercrest publishes a quarterly outlook for a wide range of economic and market statistics. Metrics like GDP and earnings are quite important to an investment outlook. However, a careful and more nuanced approach must be taken with regards to data in these highly unusual times. As an example, by convention, GDP is reported at an annualized rate based on the current quarter’s figures. In early April, any view of economic activity from April 1 to June 30 would only be an educated guess. The annualizing process further widens the range of outcomes. In addition, given the path currently projected for COVID-19 cases and of economic re-openings, the first and last months of the quarter are likely to have very different profiles. Similarly, with earnings, annual figures are of limited value for 2020, as each quarter will have a unique profile. A significant decline in the economy and earnings is clearly underway. The specific magnitude is nearly impossible to assess. Any attempts at precision in this exercise at the aggregate level of the economy or stock market are of limited value.
Instead, we will look to short-term signposts and unique indicators. Like nearly everyone with access to the internet, we look at shapes of curves for all the COVID-19 metrics. The chart presented by the Presidential Task Force forms our base case assumptions, although we create our own models as well to give a full mosaic of the current situation and trends. From a humanitarian point of view, we are keenly interested in the health situation, while from an economic monitoring point of view, we are most interested in the timeline. We also closely monitor news on treatments and vaccines, as these are key to the longer-term outlook and inform us whether and how future viral outbreaks may influence economic activity. In particular, we are paying close attention to the availability of widespread and fast testing. That capability coupled with other technology could help re-open the economy by fighting the viral outbreak with better weapons than the blunt instrument of a near-total lockdown.
The experience in China is instructive. While fair to question the validity of Chinese data, we see a general re-opening of their economy, supported by anecdotes from trusted friends and colleagues. data such as Beijing traffic and reports from our contacts of store re-openings and restaurant visits and news from global firms such as Apple and Starbucks provide further insight. In the U.S., we are constructing a dashboard of high-frequency metrics—daily and weekly data. There is no perfect answer, and we look to these shorter-term metrics as early signposts to assess the direction and timeline of an economic recovery.
Over the next few months, COVID-19 data, company-specific information, and non-traditional, high-frequency economic data will be of most relevance. We will endeavor to keep you informed of those metrics. By mid-year, traditional assessments of economic and market data will have more value. When traditional aggregate economic data becomes more relevant, we will resume publication of our economic forecast table, inclusive of GDP and earnings and with some updates to refresh the list of metrics we monitor.
Time Horizon and the Path Forward
“In the short run, the market is a voting machine but in the long run, it is a weighing machine.” ― Benjamin Graham
The essence of Graham’s quote is that sentiment rules the short term, while substance drives the long term. Markets typically look forward six months or so; today they are barely looking beyond six hours. Sentiment is quite negative and deservedly so. A useful, informal technique to gauge sentiment is to periodically rate the state of affairs—in both medical and economic matters—against a range from “worst of this crisis” to “normality before this crisis”. Informal polling of colleagues shows recent readings a bit above the worst of crisis though obviously still well below normal. Progress has been made, assistance has been provided, and time towards a bent epidemiological curve marches forward. Yet, there is much work to be done and we will sense many false starts and disappointments. Yet, as sentiment on both the virus and the economy begins to improve, markets will afford more weight to individual business fundamentals.
A three-year time horizon generally allows the action of the weighing machine to be the dominant force. As the time horizon extends, reality matters more than sentiment—coupon payments, dividends, and earnings growth: these are the sources of durable wealth creation.
Some segments of the economy will return to normal quickly, while others may experience permanent change. These differing paths to recovery and differing balance sheet characteristics are the basis for our view that active management through individual security analysis and selection, will become more important than ever.
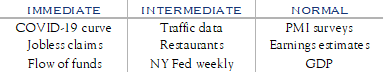
Currently, the most relevant signposts will come from monitoring the rate of change of leading indicators and the path of stimulus funds. This means watching for decreases in the growth rate of COVID-19 (the bend in the curve), monitoring the pace of weekly jobless claims, and carefully following the implementation of financial support from the U.S. Treasury Department and the Federal Reserve. The second stage will involve monitoring high-frequency alternative economic data, watching for moves off of zero in indicators that have been fully or partially stopped—things like restaurants and traffic—as well as indicators like those created by the NY Fed. As the economy starts to re-open, traditional metrics will become more relevant.
COVID-19 is vile and it is the dominant force acting on the economy and on sentiment. However, there is light in the darkness. Consider the words of the omnipresent Dr. Fauci, quoted below from an April 2nd interview with the New York Times.
“I think it will be remembered of really showing what a great country we are. We have been through, as I’ve said, if you look at the history of our country, some extraordinary ordeals. I mean, world wars and diseases and depressions,” he said. “And we’ve gotten through it. I have a great deal of faith in the spirit of the American people. We’re resilient. We’re going to get over this. And this is going to end.”
It will end. We don’t know exactly when, and so rather than peer too deeply into a cloudy crystal ball, we focus on the basics: reliance on expert individual security analysis, tax-loss activity, careful planning and customization, high-touch client communication, re-investment of maturities, patient rebalancing, and the numerous other activities practiced by our experienced Portfolio Managers that are essential to long-term success.
We remind you that we welcome and encourage communication with our colleagues, clients and friends. Finally, we borrow an excerpt from an Irish saying appropriate for these challenging times: Health be yours, whatever you do.
This communication contains the personal opinions, as of the date set forth herein, about the securities, investments and/or economic subjects discussed by Mr. Teeter. No part of Mr. Teeter’s compensation was, is or will be related to any specific views contained in these materials. This communication is intended for information purposes only and does not recommend or solicit the purchase or sale of specific securities or investment services. Readers should not infer or assume that any securities, sectors or markets described were or will be profitable or are appropriate to meet the objectives, situation or needs of a particular individual or family, as the implementation of any financial strategy should only be made after consultation with your attorney, tax advisor and investment advisor. All material presented is compiled from sources believed to be reliable, but accuracy or completeness cannot be guaranteed. © Silvercrest Asset Management Group LLC

