
Unequal Treatise
The publication of French scholar Thomas Piketty’s book Capital in the Twenty-First Century has brought inequality to the front and center of public debate. This debate—and its implications for taxation, regulation, social stability, and economic growth—is something no investor can afford to ignore. We see a more complex dynamic than what Piketty describes, one that poses profound challenges to Western economies, but also is creating new drivers for global growth.
Piketty’s main thesis is that the rise in income and wealth inequality noted in recent years is no mere fluke or passing phase; it is a deeply rooted flaw in the free market system. Capitalism, he argues, “automatically generates arbitrary and unsustainable inequalities” that undermine democratic society and can only be corrected by government intervention. Specifically, Piketty proposes an 80% tax rate on incomes over $500,000, along with an annual 2% tax on all existing wealth. While these ideas are far from being implemented, they are being actively discussed.
Piketty bases his analysis on a detailed study of tax records in developed countries, primarily Britain, France, and the United States. He devotes barely a chapter to looking at inequality in a global context, in which he focuses on the growing gap between the world’s top 0.000005% and the global average. His approach fits the traditional tendency among economists to see national economies as self-contained units, each with its own dynamics— including income and wealth distribution—that can largely be explained in reference to itself.
But the world has changed. Today, we live in an increasingly global marketplace for the very factors of production—land, labor, capital, and entrepreneurship—that give rise to income and wealth. By not appreciating this bigger picture, we believe, Piketty comes to an incomplete and highly distorted view of what is actually going on.
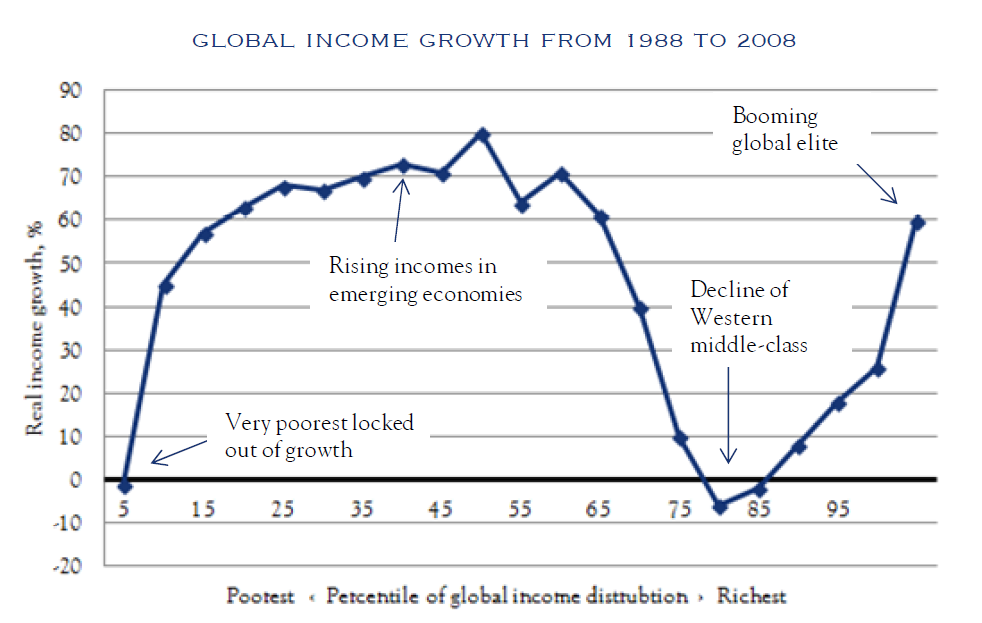
In 2012, the World Bank issued a working paper that shed some important light on what this “bigger picture” is, and why it matters. It included the following chart (Figure 1), which tells a fascinating story about what happened to people in different income strata, on a global basis, from 1988 to 2008.
The left 3/4 of the chart depicts the developing nations of the world. The poorest, in remote or war-torn regions, continued to be completely locked out of global markets. But the vast majority enjoyed dramatic income gains as the former Communist states of China and Eastern Europe, and formerly protectionist regimes in Latin America and India, joined the world economy.
The right 1/4 of the chart captures the already developed economies of Western Europe and the United States—the ones Piketty examined—as well as the very top income-earners in emerging markets like China, India, Russia, and Brazil. At the lower end of this scale, incomes have stagnated or even fallen as workers face rising competition from newly emerging peers around the world, now capable (because of more open economies, and better transportation and communications links) of performing the same tasks. For them, the global economy has become a much tougher place to add value in a way that sets them apart and above. In contrast, people at the very high end of the scale are now able to leverage their skills and relationships, as well as the savings they don’t need to spend, on a global basis. For them, globalization presents the chance to spread their wings and fly even higher.
Figure 1.
Source: World Bank
The World Bank calculates that the narrowing gap between rich and poor countries more than offset the widening gap between people within those countries. Global inequality, as measured by the Gini coefficient, actually declined from 2002 to 2008, for the first time since the Industrial Revolution. Evidence suggests that the global finance crisis, if anything, further intensified this trend.
The chart in Figure 1 looks kind of like an elephant, with its bulky body to the left and its long trunk rising to the right. That would be appropriate, because Piketty reminds us of the proverbial blind man who, asked to describe an elephant, reaches out to touch its trunk. Based on that evidence, he replies that an elephant is long and thin, like a snake. By focusing solely on the right 1/4 of the chart—the trunk—Piketty forms an equally erroneous conclusion about the true shape of inequality.
Equal to the Task?
Why does it matter? To begin with, it affects our view of capitalism, the challenges it poses, and how to “fix” them. Piketty argues that market economies invariably produce mounting inequality, for no good reason. In fact, when more countries joined the market economy, the gap between rich and poor nations narrowed significantly. For people in the richer countries, this increase in global equality meant greater competition from below and expanded opportunities at the very top, accentuating differences in earnings capacity. Ironically, it was the relentless leveling force of markets, not their alleged oligarchic tendencies, that produced this result, which was anything but “arbitrary.”
None of this means that rising inequality in developed economies like the United States can be simply shrugged off. The challenge of moving millions of people into more globally competitive, higher paying jobs is compounded by rapid advances in wireless communications, artificial intelligence, and robotics that promise to make many categories of human labor obsolete. It’s not just assembly line workers who face being replaced by machines. It’s medical technicians, cashiers, drivers, journalists … even economists. Someone smart will capture the immense value to be realized from doing these jobs better, cheaper, safer, and yes, smarter, and our lives will be better for it. But a lot of us will have to come up with new ways to earn a living, or risk seeing that living deteriorate.
In the meantime, many observers worry about the more immediate effect of less equal income distribution on consumer demand. The mass consumer market that drove the “American Century” was typified by Henry Ford paying $5 a day—twice the going rate—so his workers could afford to buy the cars they were making. In fact, Ford paid that high a wage to avoid crippling workforce turnover, thus maximizing his return on capital, rather than out of any far-sighted generosity. But the broad middle class it created was real. Modest income-earners, like Ford’s workers, tend to spend a larger part of their income, while higher income-earners, like Ford, can only spend so much and tend to save and invest the rest. If the balance shifts in favor of higher earners, the result could be a dearth of demand and a glut of savings—which sounds disturbingly like today’s economy.
Large-scale redistribution of wealth and income is one option. But unless one truly believes that, as another French thinker (Proudhon) put it, “property is theft”, it is a path fraught with both moral and practical hazards. Nor is it clear what redistribution would do to change the underlying dynamic eroding many people’s earning capacity. Some economists have speculated that as many as half of America’s current workforce may find themselves permanently unemployable, dependent on support from a far more productive elite. That’s a depressing prospect. It’s also a rather slender reed to base one’s hopes on in a global economy where, more than ever before, talent and capital can pick up and go somewhere else.
A far more likely scenario is that we will have to radically re-imagine the role of human labor in our economy, and the system of education needed to prepare people for that role. For years we’ve talked about the Information Revolution in “gee whiz” tones, seeing only the gadgets and apps that make life easier. Only now is it beginning to sink in that the Information Revolution will be at least as disruptive as the Industrial Revolution.
There is some important good news, however, if we look back to Figure 1. Up until now, the rising incomes in the left 3/4 of the chart have been mainly a supply-side story, with rapidly emerging economies reinvesting much of what they earn to further build out capacity. This lopsided trend, which relies on the developed economies to drive global consumption, is fast approaching its limits. Look at the right 1/4 of the chart and you might wonder where global demand will come from, with the middle class shrinking and incomes falling. Look at the bulging “body” of the elephant to the left, and you will see the answer: a vast pool of untapped demand. The slowing investment build-out in places like China is not the disaster many imagine, but a much-needed adjustment to a more balanced global economy, where the new producers will also become new consumers. Their buying power—earned by competing with us—is poised to become a vital driver of U.S. growth and employment in years to come.
Investment Strategy: Looking Up
Rebalancing the global economy along these lines won’t happen overnight. In fact, this year the U.S. had a terrible first quarter—much worse than anyone thought. GDP fell for the first time in two years, at an annual rate of -2.9%, the worst since Q1 2009. Out of the four components of GDP—consumption, investment, government spending, and net exports —only consumption contributed positively to growth. In contrast, all four contributed positively in Q2 and Q3 2013, and would have in Q4 as well had it not been for the federal government shutdown.
That said, a raft of positive data suggests the U.S. economy got back on track in Q2. Job growth, which defied the downturn by averaging 190,000 per month through Q1, rose to 272,000 per month for April-June, totaling 2.5 million new jobs in the past 12 months, the strongest annual growth since May 2006. The ISM factory index recorded a 13th straight month of U.S. manufacturing expansion, while a surge in the new orders sub-index (to 58.9) suggests stronger months ahead. Durable goods orders have slipped from a March surge, but were still up 2.9% year-on-year in May. Total U.S. rail traffic was up 6.2% year-on-year in the last week of June, and 4.5% year-to-date. Car sales, which were down in January and February, compared with the year before, were up 8.3% in May. The housing market has also seen a modest recovery from its winter swoon. New home sales (-3.1% y/y in Q1) were up 16.9% y/y in May, while new housing starts (-2.3% y/y in Q1) were up 9.4% y/y in May. The U.S. trade deficit, which had seen a worrying rise since November, narrowed again in May as exports recovered.
Perhaps most important, from an investor’s point of view, U.S. corporate profits remain strong. Despite the drop in GDP, profits actually rose slightly in Q1, and were up 6.8% compared to a year before. U.S. corporate profits are now 35.3% higher than their peak in the previous business cycle, in Q3 2006, well outpacing nominal GDP, which has grown by 22.3%. Corporate profits have risen to 11.2% of GDP, an all-time high—a fact that may raise social and political concerns over the gap between stagnant wages and booming profits, but also helps explains why U.S. stocks have performed so well, despite a sluggish economy.
There are two factors that can drive U.S. stock prices higher: earnings performance and valuation momentum. Last year’s 30% rise in the S&P 500 was driven in large part by a rapid run-up in P/E multiples, from a trailing P/E of 14.7x at the start of 2013 to 17.2x at the end. That’s alright, for a year where growth expectations are rising, but subsequent years are usually about delivering on those expectations. We should not expect valuation momentum to do the heavy lifting for a second year in a row.
Operating earnings per share (EPS) for the S&P 500 was up 6.0% in Q1, compared to the year before. But it was down -3.4% from the previous quarter. That means that so far this year, the 6.2% gain we’ve seen in the S&P 500 index is based on hopes for something better around the corner. With the economy rebounding in Q2, we believe earnings will rebound as well, and put more solid support beneath share prices. Our forecast EPS of $112 for 2014 as a whole, up 4.5% from the year before, is considerably more conservative than the market consensus of $119.50, but progress towards either number will be helpful.
We see no catalyst for a sustained downturn in either earnings or valuations. Given a trailing P/E ratio of 17.6, based on Q2 consensus earnings, there may well be room for higher valuations before this bull market runs its course. But investors should be mindful of placing too much reliance on valuation momentum to push this market higher, without the earnings improvements to back it up.
This communication contains the personal opinions, as of the date set forth herein, about the securities, investments and/or economic subjects discussed by Mr. Chovanec. No part of Mr. Chovanec’s compensation was, is or will be related to any specific views contained in these materials. This communication is intended for information purposes only and does not recommend or solicit the purchase or sale of specific securities or investment services. Readers should not infer or assume that any securities, sectors or markets described were or will be profitable or are appropriate to meet the objectives, situation or needs of a particular individual or family, as the implementation of any financial strategy should only be made after consultation with your attorney, tax advisor and investment advisor. All material presented is compiled from sources believed to be reliable, but accuracy or completeness cannot be guaranteed. © Silvercrest Asset Management Group LLC

