
What brings a business and market cycle to an end? What turns a recovery into a recession, a bull market into a bear? Often, it’s the accumulated products of over-enthusiasm: excessive inventories, high debt levels, low savings rates. Or it’s tightening constraints on growth, giving rise to inflation and climbing interest rates. Once-easy credit becomes harder and harder to find. Surprise shocks—financial defaults, currency devaluations, trade sanctions—can raise costs and lower profits and cause people’s expectations for the future to darken.
Despite remarkably strong economic and earnings figures in recent months, at least in the U.S., enough of these concerns have caught hold of people’s minds to cast a lengthening shadow over markets. The MSCI All Countries World Index for global equities was down −1.5% in the first half of this year, while U.S. performance is mixed, and market volatility is up. The bond yield curve has flattened or even inverted on a global basis, signaling fears of slowing growth or recession. It’s hard to say which will win out—the sunshine or the storm clouds, but markets seem to be telling us that the economy’s forward momentum, while real, may be more fragile than it looks.
Be prepared, not scared. This recovery likely has more room to run, but it is entering a more mature phase. Now is the time for investors to develop a clear-sighted view of the risks this involves and not be taken unaware.
Staying in Stride
Normally, we end each quarterly letter with an overview of the latest economic and market data. This time, we’ll start with that overview in order to frame the discussion before turning to trade wars, the flattening yield curve, and other factors worrying the market. Because far from signaling an impending slowdown, those numbers give every indication that, for the time being, the U.S. economy remains on track for continued growth.
In the first quarter, U.S. GDP growth slipped to +2.0%, pulled down in large part by the slowest quarterly rate of consumption growth (+0.9%) in nearly five years. But Q2 is now expected to bounce back, with the New York Fed projecting +2.8% growth, and the Atlanta Fed projecting a more optimistic +3.9%. Consumer confidence remains close to cycle highs, supported by the strongest average monthly job growth (+215,000 for the first half of this year) since 2015. Retail sales surged +0.8% in May, up an impressive +5.9% from a year ago, bringing sales for the first five months of 2018 up to a vigorous +5.2% above the year before. While sales of existing homes remain in the doldrums, new home sales in May were up +14.1% from a year ago, while new housing starts were up +20.3%. Auto sales, which softened alarmingly in May, rebounded to a respectable rate of 17.5 million/year in June.
This resilience in consumer spending has helped support, in turn, business confidence, hiring, and investment. New factory orders rose +0.4% in May, up a striking +9.2% from a year ago. Orders for core capital goods—a key indicator of business investment—rose +0.3%, up a solid +6.5% from a year before. Both the ISM Manufacturing and Non-Manufacturing indices advanced further into solid expansion territory in June (60.2 and 59.1, respectively), with firms continuing to report a robust stream of new orders to meet in the months ahead.
After-tax corporate profits, across the entire U.S. economy, were up a modest +2.7% in Q1, from a year before, after falling precipitously in Q4—though it’s likely both those figures were influenced by the recent tax cut bill that encouraged firms to charge losses in 2017, before lower corporate rates took effect, and allows them to immediately expense capital investment starting this year. Operating earnings per share (EPS) for the S&P 500 saw far clearer gains in Q1, rising +8% from the previous quarter and +27% from a year ago. Every one of the eleven sectors in the S&P 500 saw positive year-on-year earnings growth.
With share prices skittish, those earnings gains brought the 12-month trailing P/E ratio back below 20x at the end of Q1, its lowest level in two and a half years. If S&P 500 earnings meet consensus expectations in Q2, rising another +6%, that would push the trailing P/E ratio down to 19.4x—arguably a buying opportunity, if you believe all the economic data signaling stronger growth ahead.
Skating on Thin Ice?
With all this good news out there, why aren’t markets more buoyant? Growing concerns over the prospect of trade wars, slowing economies outside the U.S., and inflation are giving investors pause and making them wonder whether all that positive momentum is skating on thin ice.
Worries over the prospect of a trade war—tariffs on imports, retaliation against exports, or even wider-ranging measures—are obviously a major factor. We’ve tended to discount rhetoric in the past, which has served us well, but the last few months have seen a steady march from threats to actions, and to ever more serious threats. While much of what we’ve been seeing is what is called “signaling” in game theory—shots across the bow—we are at the point in the game where the players have placed their initial bets, believing the other side will back down, and are only likely to reconsider them after some real pain gets felt.
And that pain is starting to be felt. Domestic U.S. steel prices have risen over +37% so far this year, compared with just +2% for northwestern Europe and +8% for southeast Asia, hitting a wide range of steel consuming industries. The price of soybeans, a major U.S. export to China, have fallen −20% in the past two months to a 10-year low. A growing number of responses to the ISM purchasing manager surveys explicitly cite tariffs—those already enacted, and the many more being threatened—as raising costs, endangering sales, and casting a shadow over future plans, despite otherwise positive economic momentum. The Fed’s meeting minutes for June noted that companies across the U.S. are reporting “plans for capital spending had been scaled back or postponed as a result of uncertainty over trade policy.”
Concerns that high-profile large cap U.S. companies, doing substantial business abroad, could bear the brunt of foreign retaliation and disrupted supply chains might help explain why the main large cap indices have noticeably underperformed the tech-heavy Nasdaq and small cap Russell 2000. At the end of June, the Dow Jones Industrial Average was down −1.8% year-to-date and the S&P 500 was up a fragile +1.7%, while the Nasdaq had risen +8.8% and the Russell 2000 was up +7.0%. While smaller U.S. companies are hardly immune to higher input costs or the broader negative impact on the economy, they aren’t likely to be singled out for retribution like a Boeing or Qualcomm (which earns over half of its revenues from China). The same goes for a number of top tech firms like Facebook, Google, and Twitter which have been locked out of China for years now, so there’s really not much more China can do to hurt them.
Larger U.S. companies may also find themselves more directly exposed to a possible slowdown in growth abroad, in Europe, Asia, and emerging markets, which seems to be taking shape with or without a trade war. Japan’s GDP shrank −0.6% in Q1, ending a 2-year streak of positive (if unexceptional) growth, and pulling the Nikkei 225 index down −2.0% in the first half of the year. Amid mounting fears of a chaotic Brexit, with no exit deal with the European Union, British GDP growth slowed to +0.4% in Q1, its weakest rate in five years, pulling the FTSE 100 down −0.7% this year (−3.2% in dollar terms, taking a weakening pound into account). Eurozone growth slid to +1.5% in Q1, down from +2.6% in 2017, which along with the election of a populist government in Italy, and growing troubles for German Chancellor Angela Merkel at home, helped pull the MSCI Eurozone Index down −5.0% since the start of 2018. Concerns that higher U.S. budget deficits and rising U.S. interest rates will pull in dollars from abroad helped trigger a near-collapse of the Turkish lira and dragged the MSCI Emerging Markets Index down by −8.0% in the first half of the year.
Most worrying of all perhaps is China, where attempts to rein in runaway credit, along with the prospect of a damaging trade war with the U.S., have pushed domestic Chinese shares into an official bear market, with the benchmark Shanghai index down more than −20% from its peak and −14% in the year’s first half. The Chinese yuan fell −5.2% against the dollar in Q2, sparking renewed fears that Beijing might consider an even larger devaluation, triggering a much larger cycle of competitive devaluations worldwide that could create severe headwinds for U.S. growth. Unlike some, we don’t see a major Chinese currency devaluation as financially inevitable, and rather than solving China’s economic troubles, we think it would only make them worse—but that doesn’t mean Beijing won’t be talked into it, inflicting serious global consequences.
The fact that, so far, overseas markets have been hit harder by these concerns has prompted some to argue that a stronger U.S. economy is well positioned to “win” a trade war. While it’s true that U.S. exports account for only 12% of GDP (compared with 20% for China), exports and imports together amount to 27% of the U.S. economy, with wide ripple effects across the rest. And it’s important to remember that the U.S. is now engaged in multiple trade quarrels—with Canada, Mexico, Europe, China, Japan, Brazil, India, etc.—at the same time. While the damage from each bilateral conflict may be reciprocal, the harm on the U.S. side is cumulative. Moreover, investors should take no glee in signs of economic weakness overseas. A strong enough external shock—whatever the trigger—could be just the thing that knocks an otherwise sound U.S. economy off its stride.
Ahead of the Curve
Historically, one of the most reliable indicators of a coming recession is an inverted yield curve, where long-term interest rates on bonds fall below short-term rates. That’s why markets have paid close attention as the spread between the 2 and 10-year U.S. Treasury rates has steadily narrowed to just 33 basis points, its lowest since mid-2005. A number of global bond indices are actually showing an inverted curve (a negative spread) for the first time since 2007. The unequal weighting of these indices—heavier U.S. on the short end, lighter on the long end—may be causing them to overstate the case a bit, since no individual country’s yield curve has inverted, yet. But if the Fed hikes its Funds rate one or two more times (as expected this year), and longer-term rates stay stuck where they are, the spread could turn negative.
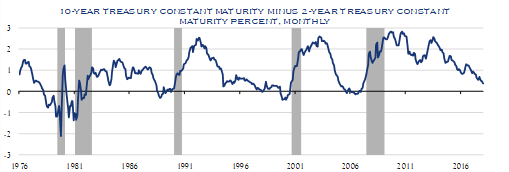
Source: FRED
One explanation why long-term U.S. rates have been reluctant to rise is that they are “anchored” in low inflation expectations, which sounds rather benign. “Anchored”, however, could mean two very different things: continuity (that inflation will stay low for an extended period of time) or fragility (that mounting inflation, or some other disruption, could readily knock the economy into recession, sending the Fed back into rate-cutting mode to stave off deflation). A flattened yield curve, which is what we have so far, could indicate the former. An inverted yield curve suggests an overheating and potentially fragile economy.
Inflation has picked up lately, though from very modest levels. Producer prices for final demand were up +3.3% in June, from a year ago, their largest gain in over six years. The consumer price index (CPI) rose at an annualized rate of +3.3% in 4Q17 and +3.5% in 1Q18, driven partly, but not entirely, by rising energy prices. The year-on-year figure has lagged a bit, due to a lull in inflation in 2Q17, but had risen to +2.8% in June, also the highest rate in six years. Even the more subdued PCE price index has risen to +2.3%, slightly above the Fed’s 2% inflation target.
Anticipating the future course inflation will take—in particular, whether it will accelerate and drive up short-term and/or long-term interest rates—is complicated by the fact that there are several layers to the story. There are long-term, structural trends putting downward pressure on prices; short-term, cyclical constraints that are starting to put upward pressure on prices, and an unprecedented overhang in the money supply that could make things difficult, if the Fed ever really needs to rein in rising inflation.
Some of these deflationary trends are demographic: an aging Baby Boomer population, together with delayed family formation among younger Millennials, has reduced the number of Americans in their peak spending years. Rapid technological advances have put downward pressure on prices for many goods and services, and in the case of workplace automation, on the price of labor as well. Industrial policies in China have encouraged chronic over-investment in excessive capacity, bidding up the price of inputs and driving down the price of outputs, on a global basis. These imbalances have not been fixed; instead, China is doubling down, looking to build up even more capacity, this time abroad, through huge overseas investment programs like One Belt One Road (OBOR). The effect will be more of the same.
The deflationary demographics we mentioned—aging or even shrinking populations, youths living longer with their parents—are actually more intense in Europe and Japan than they are in the United States. But they still have an impact on U.S. prices. Deflation abroad keeps interest rates there low, which encourages capital to flow towards higher returns in the U.S. That boosts the U.S. dollar, which makes imports cheaper, and puts competitive downward pressure on prices, at least for tradeable goods and services. The stronger (and possibly more inflationary) the U.S. growth, the wider the interest rate differential, the greater the capital flows, the more those (possibly inflationary) prices get reined in. The same goes for efforts to stimulate the U.S. economy through, say, tax cuts that increase the budget deficit. As a result, it’s hard for U.S. inflation to gain too much of a lead on somewhat damper global trends.
Nevertheless, price pressure in the U.S. is gaining some momentum, because at this point in the business cycle, at least a couple of resource constraints are beginning to bite. The most obvious is the price of oil, which has risen, quietly but steadily, +64% over the past 12 months. While daily price moves have often been driven by news headlines—the collapse in Venezuelan oil production amid growing political chaos, the reimposition of U.S. sanctions on Iran, on-again off-again moves by OPEC and Russia to limit their own output—we trace the most important dynamic back to when a large number of high fixed-cost projects were shelved after oil prices took a steep dive starting in mid-2014. While a surge in U.S. shale drilling has covered for most of that missing capacity, these highly responsive but much faster-depleting wells don’t have the staying power of more conventional reserves to meet steadily rising demand. Rising prices will eventually restart more investment, but such projects require a lengthy lead time to get off the ground—which means mounting price pressure won’t be resolved quickly. Nor is that pressure confined to the U.S., so it won’t be reined in by counter-pressure from abroad.
Besides rising energy prices, the main cyclical constraint on U.S. growth that drives up inflation is typically a tightening labor market. With reasonably robust job growth for the eighth year in a row, and the official unemployment rate down to 4.0%, one would expect to hiring competition driving wages up. Yet hourly wages are only +2.7% higher than a year ago, with little sign of acceleration, whereas the peak of a cycle typically sees wage growth closer to +4%, for a year or more. Many blame a historically low labor participation rate, which they suspect hides a large pool of “hidden unemployed” waiting to be brought back into the workforce. That be the case, but when we restrict our attention to the prime working age population (25–54 years old) to exclude a growing portion of people who are retired or attending college, we see that the ratio of employed people has been steadily rising from 75.0% in June 2011 to 79.3% now, only a single percentage point below where it peaked last cycle (80.3% in January 2007) and not that very far below its all-time high (81.9% in April 2000). The pool of “hidden unemployed” is close to being drained. That may be why we keep hearing more and more reports of companies having a hard time finding qualified workers, which should force them to start bidding up wages.
While the headline inflation numbers seem tame, the ISM purchasing manager surveys are one place where growing price pressures are being reported loud and clear. The ISM Manufacturing price sub-index hit an eye-popping 79.5 in May, and eased off only slightly since. While this is a diffusion index, which tells us more about how widely price pressure is being felt, as opposed to its intensity, the survey comments from the past half year reflect a growing chorus of concerns about tightening supply chains and mounting costs. The artificial constraints imposed by new trade barriers could add further to these pressures. While the evidence may be anecdotal, it’s become a steady drumbeat one can’t entirely ignore.
The final layer of the inflation onion is the monetary overhang. As we’ve mentioned in prior notes, the remaining $1.9 trillion in excess bank reserves created the Fed’s Quantitative Easing (QE) bond and purchases make it impossible to restraint credit creation by conventional means (limiting the amount of reserves available to banks). Instead, the Fed is hiking rates by raising the rate of interest it pays on that giant pool of excess reserves—in effect, paying banks not to lend. So far, at rates under 2%, this has posed no problem. But in a typical cycle, the Fed Funds rate often goes to 5–6% to keep inflationary growth from bubbling over. Not only would the Fed be injecting $100 billion or more per year in additional reserves (significantly slowing the process of unwinding the Fed’s QE balance sheet), it would essentially be gifting that money to banks, at zero risk, to persuade them not to make loans to the public. That sounds to us like something a lot of people might object to, politically, but it’s also the only way the Fed would have to keep inflation under control. Hopefully we’ll never have to find out, but hope isn’t a game plan.
Putting this all together, we expect the most likely path is for inflation to remain, if not subdued, at least moderate for some time. But we can picture scenarios where not only could inflation flare up, but the Fed could be hamstrung in its ability to control it effectively. We can also envisage a situation where, because of the broad deflationary trends noted earlier, companies face rising costs but have trouble passing them onto consumers, squeezing their profits instead.
If the yield curve inverts, in the near future, there will be some who argue that it simply reflects the Fed trying to normalize rates amid distortions caused by ultra-low or even negative interest rates abroad, not a response to runaway inflation. And that may be true. But it’s also worth considering whether those stubbornly low long-term rates, both at home and abroad, might reflect the very fragilities we discussed earlier—the risk of a trade war, a currency devaluation by China, or some other external shock, quite apart from inflation taking off. The yield curve may well be distorted, but given its track record, we’d be foolish not to pay it close attention.
Be Prepared, Not Scared
Given these concerns, what’s an investor to do? For one thing, let’s not forget all that positive news we reviewed at the start of this letter. While scanning the horizon, we shouldn’t neglect to see what’s right in front of us. Nearly all the data, at least in the U.S., points to continued economic growth. Corporate earnings are expected to hit new highs, boosted by tax cuts. The annual inflation rate, at this point, is only slightly above target. The yield curve is flatter, but is not yet inverted. Market worries have pushed equity valuations down more than three full multiples from their January peak. The Equity Risk Premium—the additional return that investors in riskier stocks can expect to earn, compared to less risky bonds—has widened again to 5.4%, compared with its long-term average of 4.1%. This suggests that, even looking through the end of the cycle, a patient investor will be well rewarded for taking equity risk, even now.
That said, the bull market won’t last forever, and we can see trends and developments taking shape that could someday bring it to an end. If markets had seasons, this would be early autumn. There’s a nip in the air, an occasional chilly breeze. The leaves aren’t falling, but they may start soon. There might well be some days of “Indian Summer” ahead, a new bout of warm sunshine. But it still makes sense to dig into that closet and start unpacking some jackets, hats, and scarves, so as not to be caught by an early frost. It is a time when disciplined asset allocation and active, judicious stock picking matter more than ever, protecting your downside while staying invested in companies with solid balance sheets, strong pricing power, and resilient growth paths, firms healthy enough to last the winter and come bouncing back in spring. Because there will be a spring, and a wise investor will be prepared for that too.
This communication contains the personal opinions, as of the date set forth herein, about the securities, investments and/or economic subjects discussed by Mr. Chovanec. No part of Mr. Chovanec’s compensation was, is or will be related to any specific views contained in these materials. This communication is intended for information purposes only and does not recommend or solicit the purchase or sale of specific securities or investment services. Readers should not infer or assume that any securities, sectors or markets described were or will be profitable or are appropriate to meet the objectives, situation or needs of a particular individual or family, as the implementation of any financial strategy should only be made after consultation with your attorney, tax advisor and investment advisor. All material presented is compiled from sources believed to be reliable, but accuracy or completeness cannot be guaranteed. © Silvercrest Asset Management Group LLC

