
“Weebles wobble but they don’t fall down.” – 1970s toy commercial
“Don’t go wobbly.” – Margaret Thatcher in the lead-up to the First Gulf War
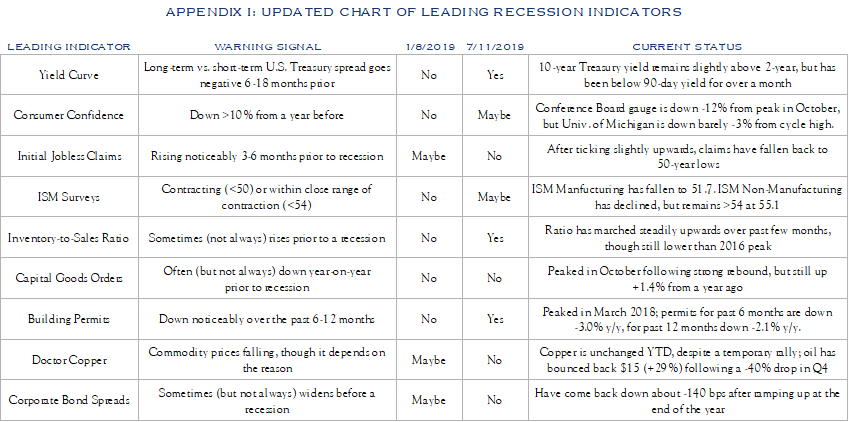
Wobbly. That’s probably the best word to describe the latest U.S. economic data. While Q1 GDP growth and June jobs growth came in strong, momentum across a number of underlying measurements has slackened. Many see the partial inversion of the yield curve as predicting that the economy will weaken further—but is such a conclusion warranted?
In our view, four main factors will determine which direction the economy takes from here: trade, consumers, credit, and inflation. A closer look, at each factor in turn, suggests that while the economy is slowing, there’s still a real possibility it may keep its head above water. And if it does stumble into recession, there’s little sign that would translate into the kind of deep and lengthy crisis that many investors fear. Spooked by the prospect of a downturn, markets are putting too high a price on safety in an environment where accepting equity risk still promises attractive longer-term rewards.
Trade
The prospect of trade wars, on multiple fronts, has cast a shadow over the outlook for the U.S. economy. Share prices, at home and abroad, plunged in May after U.S.-China trade talks broke down in acrimony and President Trump threatened steep tariffs on all imports from Mexico, only to rebound in June when the danger of further escalation appeared to recede. Still, in June, the ISM surveys of purchasing managers across a wide range of industries was a chorus of complaints and worries over the negative impact of tariffs, either enacted or anticipated.
The rationale for trade sanctions is to create a more level playing field for the U.S. to compete in the global economy. In past notes, we’ve questioned how effective they will actually be at fixing the deep structural imbalances, at home and abroad, that have given rise to chronic U.S. trade deficits. As we anticipated, a larger federal budget deficit translated to a wider trade deficit over the past year, despite waging trade battles to reduce it. Meanwhile, tariffs and the uncertainty caused by the constant drumbeat of threats impose real costs on the economy.
A report by Barclays estimates that the direct cost of following through on Trump’s threat leading into the G20 meeting, imposing 25% tariffs on nearly all Chinese imports, could shave 0.2–0.3% off U.S. GDP growth long-term—with indirect costs from shaken business and consumer confidence, and financial market volatility, potentially looming much larger. They projected that China tariffs could reduce S&P 500 earnings per share (EPS) by −2.2%. That may not sound like much, but with Q2 earnings expected to be up just +2.0% from a year ago, it makes a difference. The consumer discretionary sector, whose quarterly earnings are already expected to be down −3.3%, could see them drop a further −7.5%. Industrials, down −8.1%, could drop a further −3.1%. Information technology, up +2.2%, could lose −5.8%; a Chinese ban on Apple, in retaliation for the U.S. ban on Huawei, could shave off a further −3.7%. Barclays estimates that Trump’s tariff threat towards Mexico, if implemented, could slash S&P 500 EPS by an additional −2.6%. This is what CEOs, and markets, are so worried about.
We don’t think this kind of “trade Armageddon” scenario is really likely, but we don’t see those worries going away anytime soon either. The G20 ceasefire may, for the moment, have averted 25% tariffs on another $300 billion of Chinese imports, but tariffs on an existing list of $200 billion had already been notched up from 10% to 25%. Nor is it clear how long the ceasefire will actually hold. In recent weeks, the U.S. raised a broad range of tariffs on India and slapped a 400% tariff on steel from Vietnam, after the President (heading to the G20) called it a “worse abuser” than China. Along with the specter of tariffs aimed at Mexico, these moves undercut the most viable alternatives for U.S. companies trying to mitigate the impact of tariffs on China. Meanwhile, the U.S. is teeing up proposed tariffs on auto imports from Europe and Japan. Even if only a fraction of these measures actually come to pass, businesses find themselves facing a host of possible disruptions and dilemmas.
Perhaps it is no surprise, then, that momentum has cooled. The ISM Manufacturing Index slipped to just 51.7 in June, still in expansion territory, but noticeably weaker. New orders were a stagnant 50.0, and inventories and backlogs were in contraction. The Markit Manufacturing PMI reading for June was just 50.6, barely treading water, with the Services PMI hardly much better at 51.5, after hitting a 39-month low in May. Actual industrial and manufacturing output peaked in December and have declined since. Durable goods orders in May were down −2.8% from a year ago, while orders for core capital goods—a key indicator of business investment—have leveled off at just +1.4%, compared to a year ago.
Trade quarrels aren’t the only thing weighing on growth—slowdowns in Asia and Europe have deeper and more extensive roots, which we’ve long noted. But more and more companies are citing these quarrels as a major reason they are holding back, as they wait for the next shoe—or tweet—to drop. Whether the prize of “better trade deals” eventually proves worth it or not, tensions over trade come at a time when growth is facing other headwinds, knocking it more off-balance. Even if their bark is worse than their bite, as we suspect, ongoing trade battles are causing people to focus more on the economy’s downside risks than its upside potential and shaping their choices and actions accordingly.
Consumers
One area where companies aren’t holding back, at least not yet, is hiring. The U.S. economy added a better-than-expected +224,000 jobs in June, which was important because jobs growth in May, at just +72,000, was disappointing and caused some to worry. Monthly jobs growth for the first six months of 2019 averaged +172,000, down from +235,000 in the first half of 2018, but still a resilient number. Just as important, initial jobless claims remain close to 50-year lows, indicating that despite some high-profile headlines, layoffs—often an early indicator of a recession—have yet to see any meaningful uptick. Along with steadily rising hourly wages, up +3.1% from a year ago, expanding payrolls are helping to drive personal income growth, which is up a solid +4.1% from a year ago.
All of this translates to fairly buoyant consumer confidence and continued spending. The University of Michigan’s consumer sentiment gauge for June came in at 98.2, exactly the same as a year ago, and within a few points of cycle highs. Consumer spending, in May, was up a healthy +4.2% from a year ago. That has undoubtedly helped bolster the broader non-manufacturing sector of the economy, whose ISM index, though it has slipped, remains at an expansionary 55.1, with new orders at a still healthy 55.8.
That doesn’t mean consumers are impervious to shocks, whether from trade or something else. Consumer confidence took a noticeable hit during the federal government shutdown, starting in December, as did spending. While the University of Michigan’s gauge has fully recovered, the Conference Board’s has struggled to regain the 18-year high it achieved in October. It dropped almost 10 points from May to June, in a move at least partly attributed to alarm over tariffs and trade wars. Confidence in the job market wobbled a bit as well: the number of consumers saying jobs are “hard to find” shot up from 11.8% to 16.4%.
Consumer confidence clearly can’t be taken for granted, but as long as companies continue to hire, it should rest on reasonably solid foundations. Steady job growth and consumer spending helped pull the economy through the energy and manufacturing slump it went through in 2015 and 2016, without a recession, and could potentially do so again. We certainly aren’t seeing any of the jobs or consumer-related signs that typically warn of an approaching recession.
Credit
If there’s one area where consumers are showing greater caution, it’s towards large purchases such as homes and automobiles. These are important to watch, not only because they can have large ripple effects across the rest of the economy, but because they tend to be driven by the cost and availability of credit. Business and market cycles are in large part credit cycles, where optimistic businesses and consumers pile up debt, only to be forced to rein themselves in, slowing the economy.
The housing market in the U.S. has been stop and go this entire recovery, but it is looking more and more like we may have recently hit an inflection point. Private residential construction spending peaked last April and has since declined by −11.4%. New home sales in May were down −3.7% from a year ago and median prices were down −2.7%. New building permits in the first five months of 2019 were down −3.7% from the same period a year before—a decline that, while still fairly modest, can sometimes signal an approaching recession. Auto sales have plateaued since 2015, following worries that subprime car loans were getting out of control, and slowed to a rate of 16.9 million per year in the first half of 2019.
Starting in December 2015, the Federal Reserve steadily raised its Fed Funds Rate, from nearly zero to 2.25–2.50% by December 2018, as the U.S. economy gained momentum. These rate hikes, in turn, pushed up mortgage and car loan rates. Though by historical comparison, these borrowing rates were still very low, the increase may have played some role in curbing demand.
The weakening of broader economic data, however, caused the yield curve to partially invert after the Fed hiked rates in December 2018. Long-term Treasury yields fell below rising short-term rates, indicating that the market expected the Fed would be forced to cut rates again, and soon, to revive flagging economic growth. At the same time, in December, high-yield bond spreads began to widen, suggesting that investors thought riskier corporate borrowers were at greater risk of default, as economic and credit conditions worsened. Both an inverted yield curve and widening corporate bond spreads can be signs of a coming recession.
The Fed has since signaled that it is done raising rates for now and is prepared to cut rates if conditions warrant. Optimists point to the mid-1990s, when preemptive rate cuts by the Fed were credited with reviving growth and staving off a possible recession. It’s worth noting, however, that the Fed Funds Rate at the time was 6.0%, a level far more likely to have been impinging on economic growth, and that unlike now, the yield curve never actually inverted.
It’s possible that cutting rates could give home and automobile sales a much-needed boost. Whether it can revive business investment and sustain confidence in the face of trade wars and other more substantive worries is not as clear. When the Fed signaled, with its June “dot plot”, that it is likely to follow through on the rate cuts markets expect, the yield curve didn’t become less inverted, it just shifted lower. But since the Fed announced in January that it would stop tightening, corporate bond spreads have narrowed once again. One way to interpret this combination of moves—the first signaling “risk off”, the second “risk on”—is that markets are skeptical Fed rate cuts can prevent the economy from stumbling, but that a “dovish” Fed makes it less likely such a stumble will turn into a more serious credit crisis.
Inflation
The main reason the Fed raises rates is to prevent the economy from overheating, and the reason it’s currently in the position to cut rates, if needed, is that inflation remains subdued. Far from accelerating, as they looked poised to do a year ago, price pressures have receded. The Consumer Price Index (CPI) peaked last July at +2.9% year-on-year and has since slowed to +1.8%. The Producer Price Index (PPI), often a leading indicator, peaked last June at +3.4% and has fallen off to +1.9%. Both are below the Fed’s target rate of +2%. The Fed’s preferred PCE price index slowed to a crawl in Q1, at an annualized quarter-on-quarter rate of just +0.5%.
There are typically two main drivers of inflation in the U.S. economy: energy and wages. Wage growth gradually picked up through 2018, to a peak of +3.4% (from a year before) in February, but that’s still relatively modest by historical standards. It has actually eased off in recent months to +3.1% in June. That suggests some hidden slack in the labor market, even though the official unemployment rate is just 3.7%, close to its lowest level in 50 years. Still, the employment to population ratio for prime working-age people (ages 25–54) has seen a steady march upwards to 79.7%, just shy of its previous cycle peak in 2006, when wages were rising by +4.2%. It’s reasonable to think that, if companies keep hiring, wage pressure could soon pick up again.
Energy is a different story. Despite the occasional headline from Venezuela or the Persian Gulf that rattles markets with fears of disrupted supply, the Brent oil price, at $67/barrel, is −10% below where it stood in mid-May, −21% below its earlier peak in October, and −40% below the $110 level where it held steady for nearly three years before its dramatic collapse midway through 2014. The reason is straightforward: in 2018, according to the International Energy Agency, non-OPEC supply (led by U.S. shale production) grew at over double the rate than global demand, and is projected to once again outstrip demand growth this year and next. The economic slowdown in Asia and Europe—both major energy importers—has accentuated this downward pressure, enough to offset any saber-rattling or political unrest in other quarters.
Inflation is low and looks likely to stay at acceptably modest levels for the immediate future. That gives the Fed a great deal of leeway in giving the economy a boost, if it needs one. That could be important, because the chances of Congress and the President getting together, amid the sparring of an election year, to pass some kind of fiscal stimulus—such as the oft-discussed infrastructure package—appear less and less likely. With the fiscal lever out of reach, all eyes look to the Fed to see if monetary easing can keep the economy steaming ahead.
Don’t Go Wobbly
Looking at these four factors—trade, consumers, credit, and inflation—we see an economy that looks wobbly, not necessarily set to go under. Businesses have been rattled by trade tensions that could easily go awry, but consumers are reassured by continued hiring, and are willing to spend. Low inflation gives the Fed room to ease, but it’s not certain how effective cutting already low interest rates will be in keeping the economy on track.
These uncertainties make for a market that is vulnerable, and likely volatile. But it’s also a market where avoiding risk can be quite expensive. The S&P 500 index has gained +17.3% so far this year, for a total return (including dividends) of +18.5%, causing the 12-month trailing P/E ratio to inch back up to 19.1x. That may sound elevated, especially if you are concerned about a slowing economy, but the global bond rally has made safe harbors far more expensive. The implied P/E ratio of the 10-year U.S. Treasury, at 2.0%, is 50.0x, and the Equity Risk Premium (ERP) now stands at 5.9%—well above its historical average of 4.2%. In other words, many investors are so spooked by the prospect of a downturn that they are willing to leave plenty of shorter- and longer-term returns on the table for those willing and able to ride out any intervening storm. There is a sizeable reward to be reaped by investors capable of looking through the end of this business cycle—whenever it may come—and into the next.
The U.S. economy is slowing, and it may stumble. If it does “fall down”, there is reason to believe it will pick itself up again, and soon. This is where discipline and long-term thinking really come into play. When the economy goes wobbly, investors have to resist the urge to go wobbly too.
What does this mean for investors? The most important question is whether the extreme economic cyclicality introduced by COVID is enough to enact another regime change—either back to inflation and rates being the dominant force, a return to the quest for growth, or to a new regime altogether.
Outlook
The COVID recovery trade is closer to an end than a beginning. The most likely scenario is a return to a slow-growth world, where individual company performance matters most of all.
This shift from the macro to the micro will benefit active management. Stock-pickers can find motivated management teams and great business models that are able to outperform a relatively low-growth environment which is likely to persist from 2022 onwards.
For now, the green shoots in the economy are encouraging, the spring flowers in Central Park are beautiful, and we enjoy each day of robust growth and recovery. We favor continued exposure to equities at a level slightly above baseline, and a diversified mix across value and growth including both cyclical growth and organic growth, recognizing that stock selection remains critical.
This communication contains the personal opinions, as of the date set forth herein, about the securities, investments and/or economic subjects discussed by Mr. Chovanec. No part of Mr. Chovanec’s compensation was, is or will be related to any specific views contained in these materials. This communication is intended for information purposes only and does not recommend or solicit the purchase or sale of specific securities or investment services. Readers should not infer or assume that any securities, sectors or markets described were or will be profitable or are appropriate to meet the objectives, situation or needs of a particular individual or family, as the implementation of any financial strategy should only be made after consultation with your attorney, tax advisor and investment advisor. All material presented is compiled from sources believed to be reliable, but accuracy or completeness cannot be guaranteed. © Silvercrest Asset Management Group LLC

