
The Path Ahead
The double-hulled canoe Hōkūleʻa returned home in 2017 to Hawaii, having navigated 40,000 nautical miles and making 85 port visits around the globe. No modern navigational techniques or equipment were used. Instead, the canoe fulfilled its journey solely on the art and science of Polynesian wayfinding, a technique thousands of years old relying on intensive study of present surroundings and nuanced observations on the direction of travel.
COVID’s disruption of economic activity similarly has left us lacking the GPS of modern economic and investment metrics. Massive changes have created an unnervingly wide range of potential economic outcomes. It is challenging and humbling to look to the future, yet to invest over a three-year, forward-looking time horizon, we must consider the current state of affairs and future possibilities. We are forced to return to the basics to form an investment outlook, deeply assessing current conditions and the path of travel.
Three elements are critical: the economy, earnings, and valuations. COVID will strongly determine economic activity. In turn, economic activity, and perhaps the political environment, will drive earnings. Lastly, interest rates and sentiment will influence valuations. Together, they form an outlook grounded in current events and informed by reasonable assumptions of ever-changing conditions.
The Economy
COVID continues as a significant challenge, equally vexing and complex. Health conditions vary globally, nationally, and regionally with the virus spreading in several regions, while regressing in others. The fits and starts of economic re-openings have followed suit. Nonetheless, economic conditions are now unquestionably better than mid-April, when consumer activity ground to a near halt.
Just over 100 days ago, COVID made its opening salvo against the U.S. Significant progress has been made since. Knowledge on avoidance (masks), treatment (hospital procedures), and vaccines (over 100 possibilities) means progress will continue. Over these past weeks, even as rising case counts dominate headlines, leading expert commentators, Dr. Fauci and Dr. Gottlieb, have expressed cautious optimism that an effective vaccine will emerge—likely in late 2020, with dosages available in 2021. In the meantime, we are adapting to life with COVID, and we are gaining confidence that a post-COVID era will emerge.
One of the most visible signs of COVID destruction has been the job market. As shown in the chart below, total employed in the U.S. plummeted from over 150 million to 130 million. Jobs and the consumer are the heart of the U.S. economy. Yet, while consumer sentiment (confidence) declined during this job plunge, it did not decline by a level proportional to the epic pain caused by COVID. Employees likely saw, and continue to see, many of the layoffs as temporary. This can be found in the detailed tables produced by the Bureau of Labor Statistics and the Atlanta Fed reviewing metrics related to labor market disruption as compared with job losses in 2008.
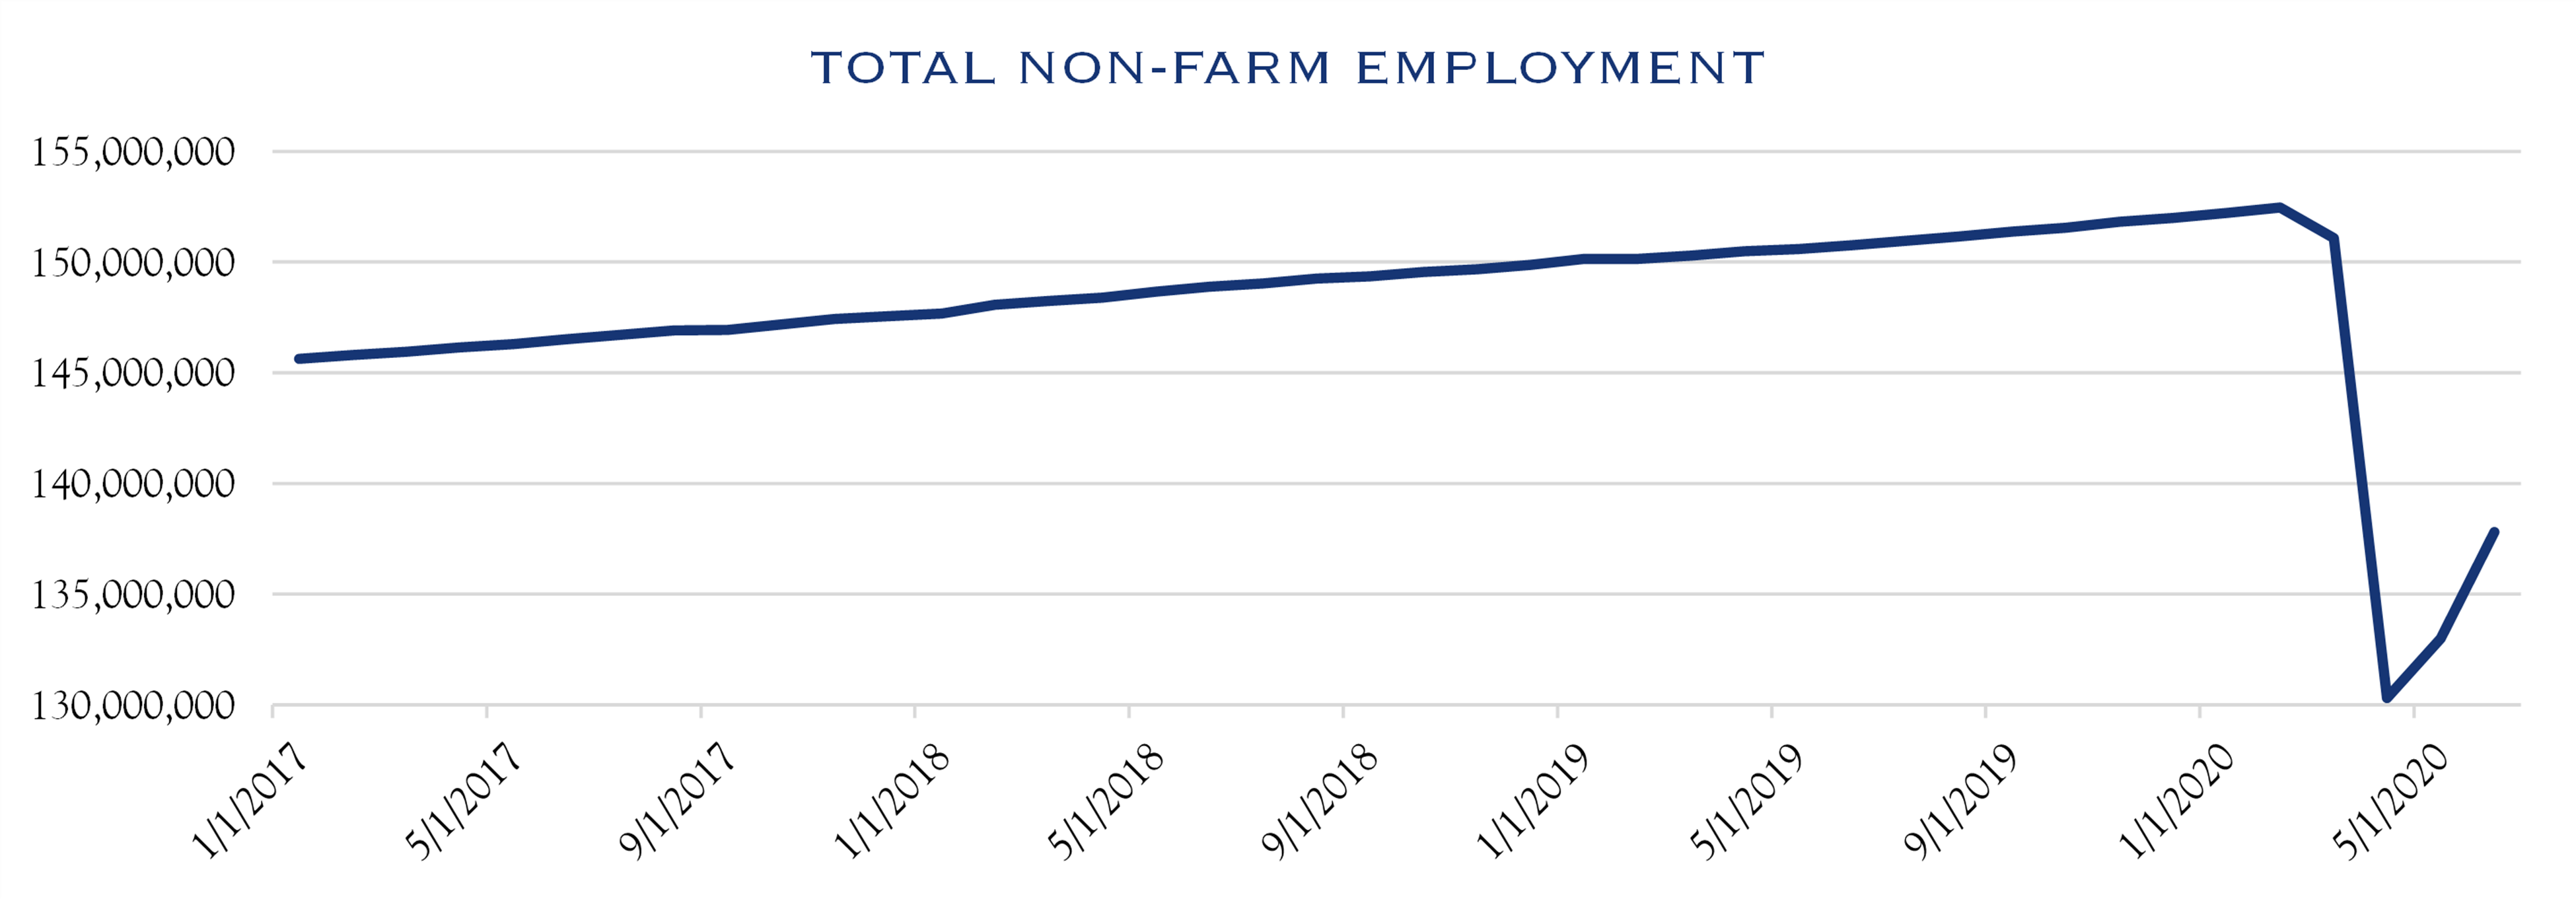
Source: Bureau of Labor Statistics (BLS), Bloomberg
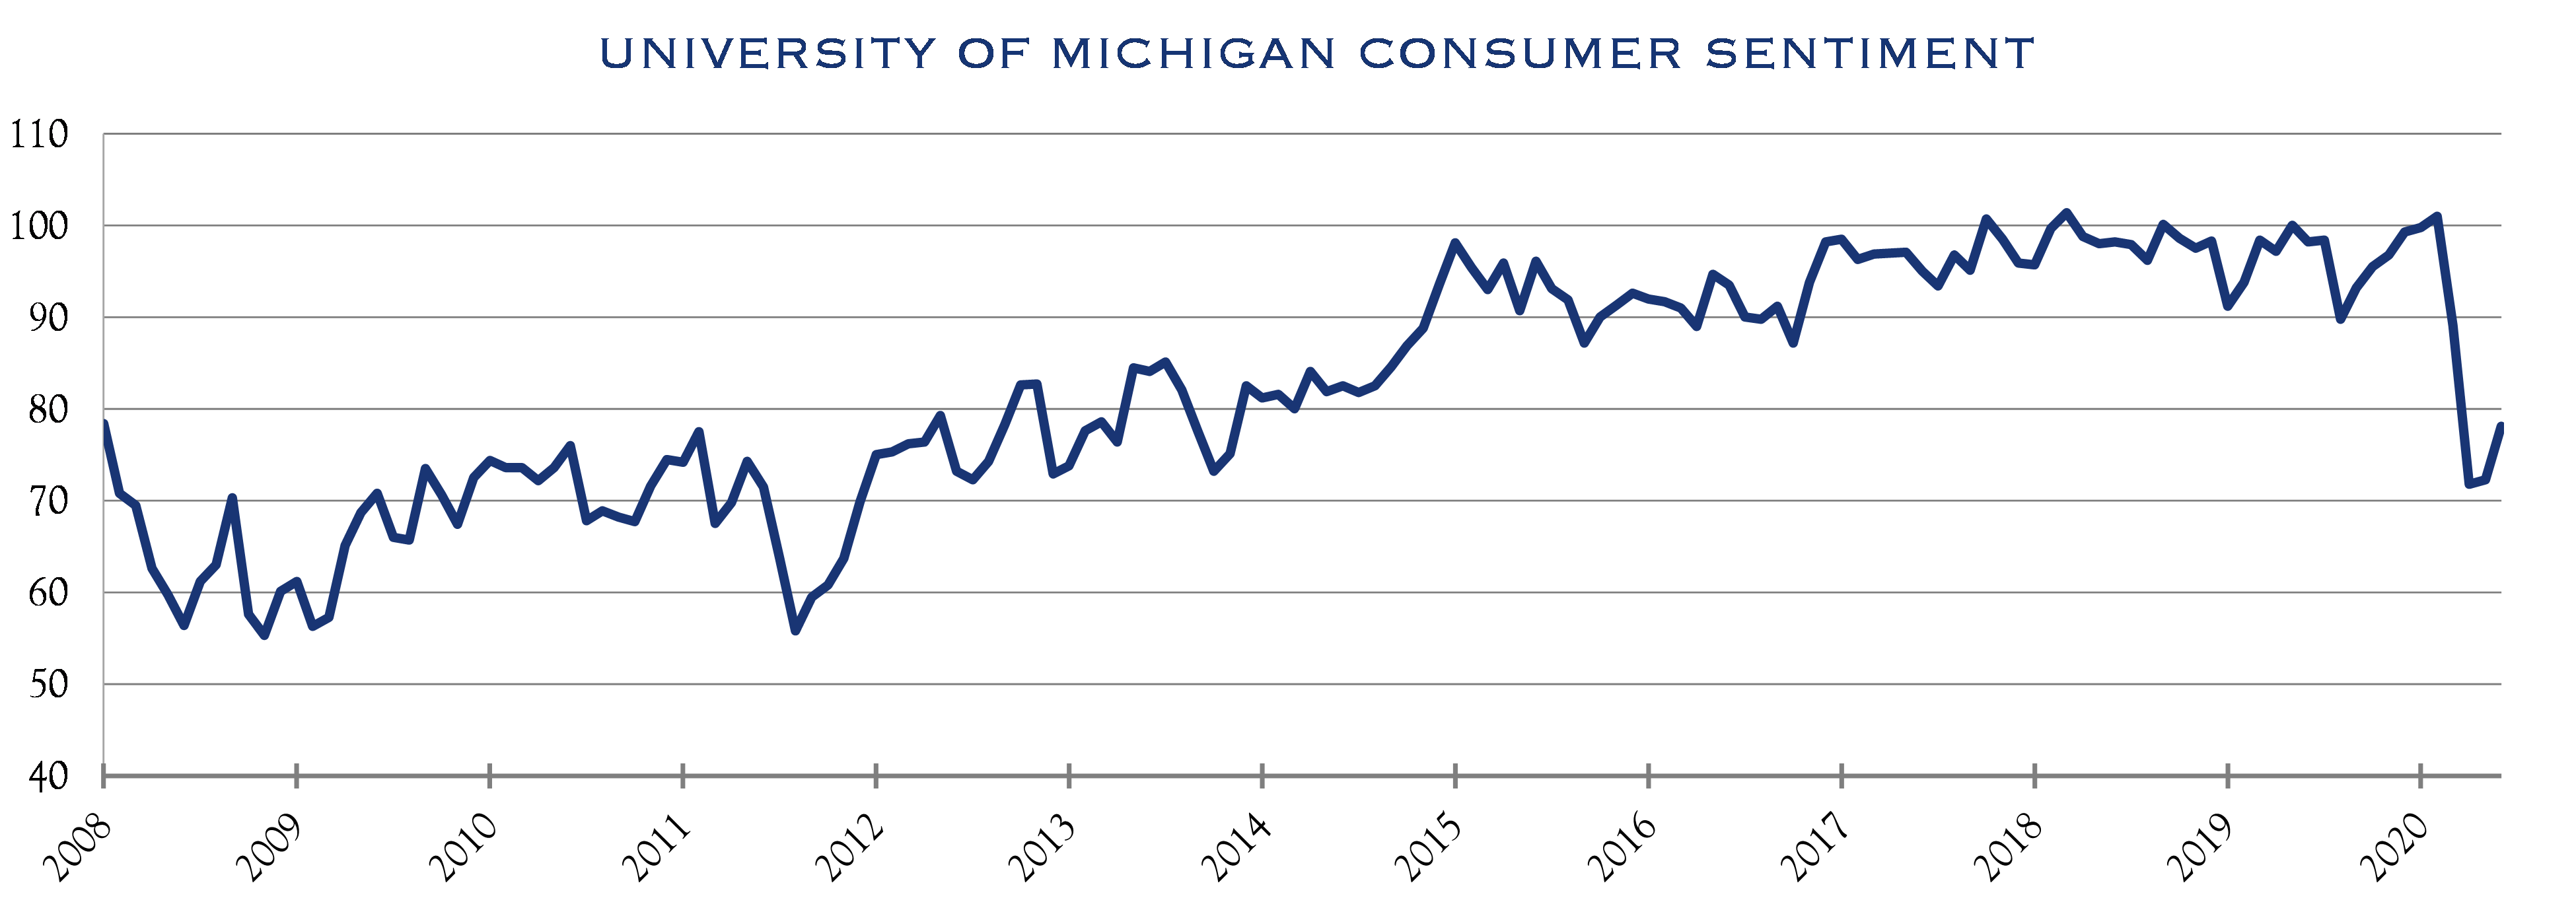
Source: University of Michigan Index of Consumer Sentiment, Monthly survey data since 1978, Bloomberg
Throughout the COVID crisis, the Institute for Supply Management (“ISM”) survey data has provided a measure of the direction of (expanding/contracting) business activity. Shown below, it is easy to see the massive shutdown in activity (contraction), followed by a major V-shaped improvement (expansion). While this expansion occurs off a low level, it indicates positive movement. This is important since financial markets remain more focused on direction than location.
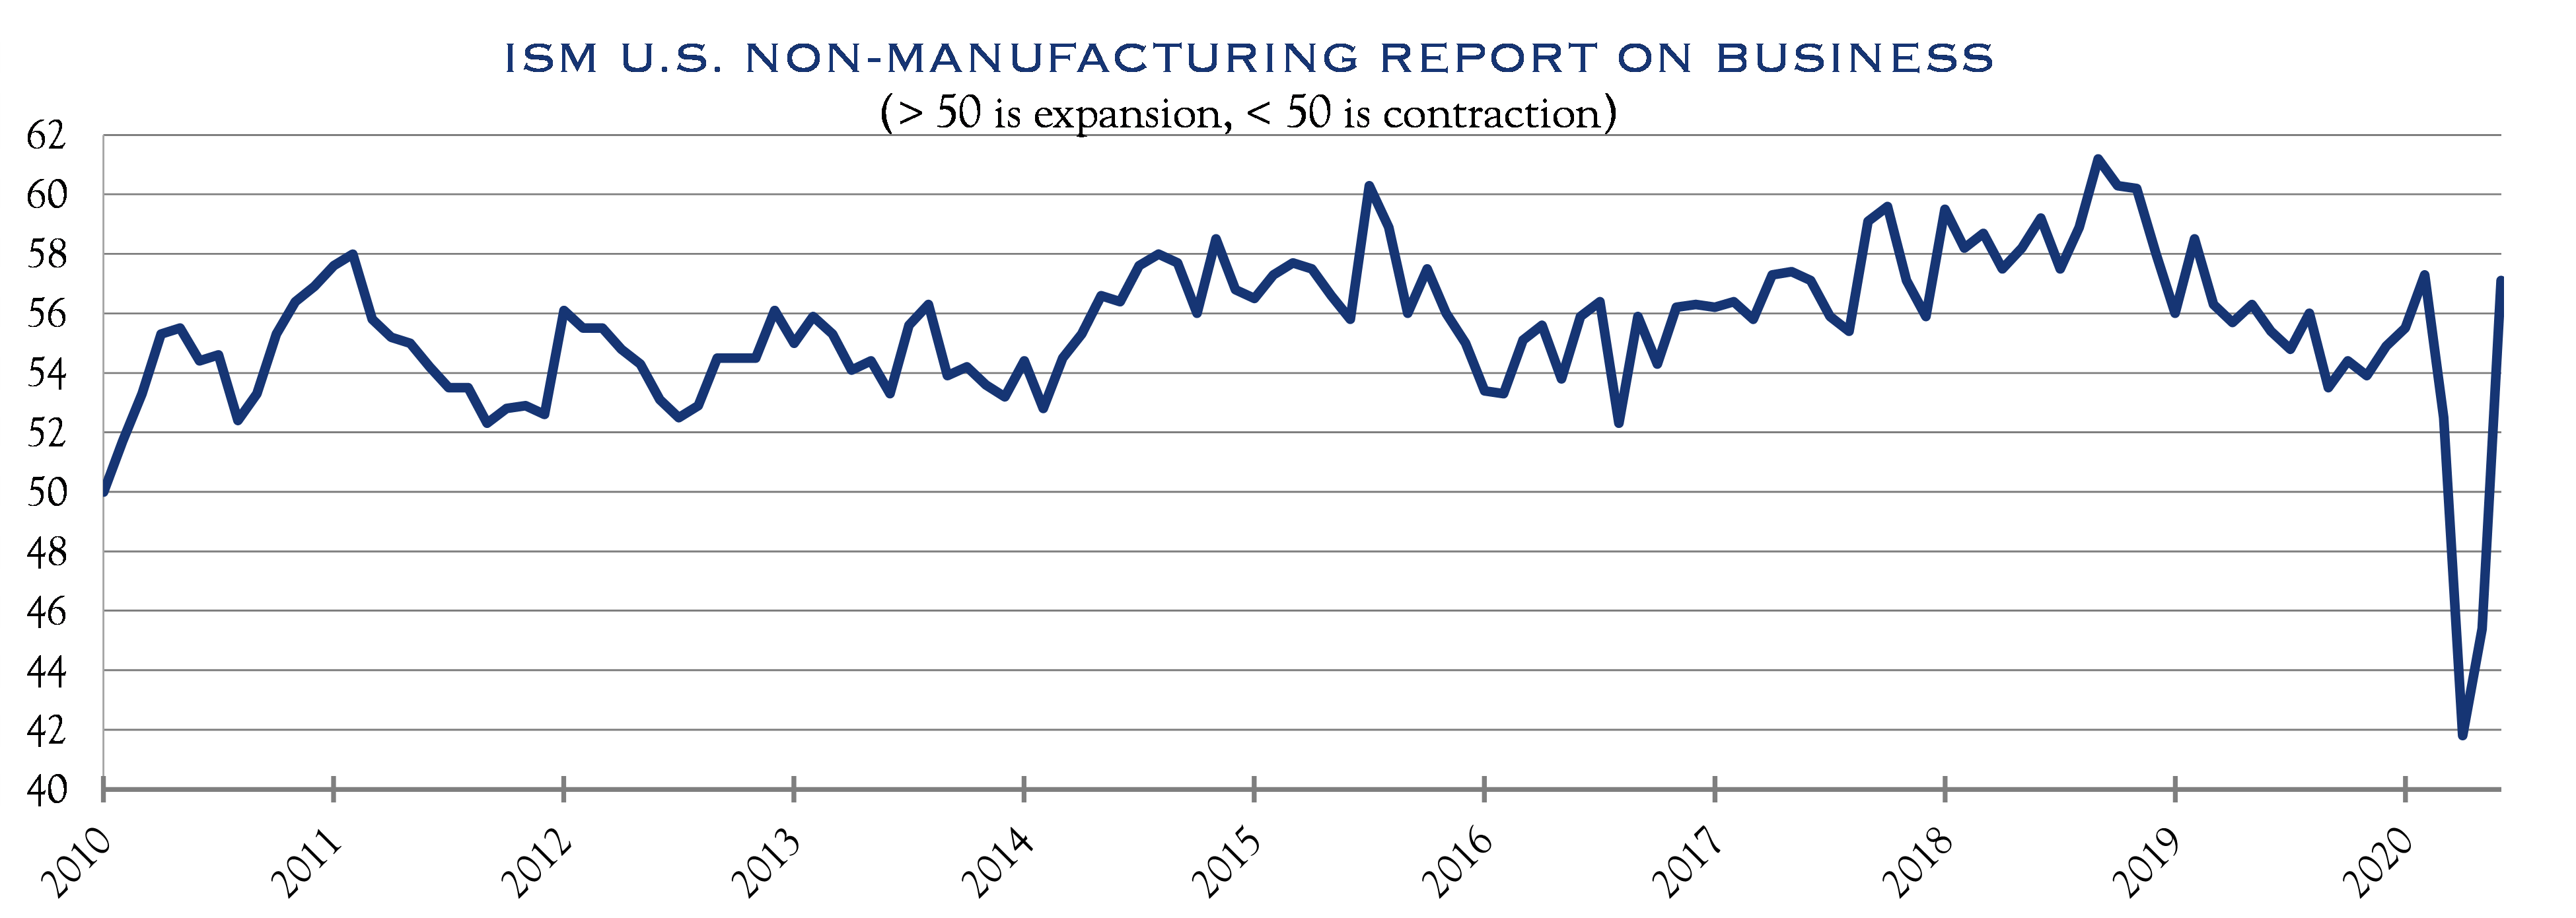
Source: Institute for Supply Management, Institute for Supply Management Non-Manufacturing ISM® Report On Business®, Monthly survey data since 1931, Bloomberg
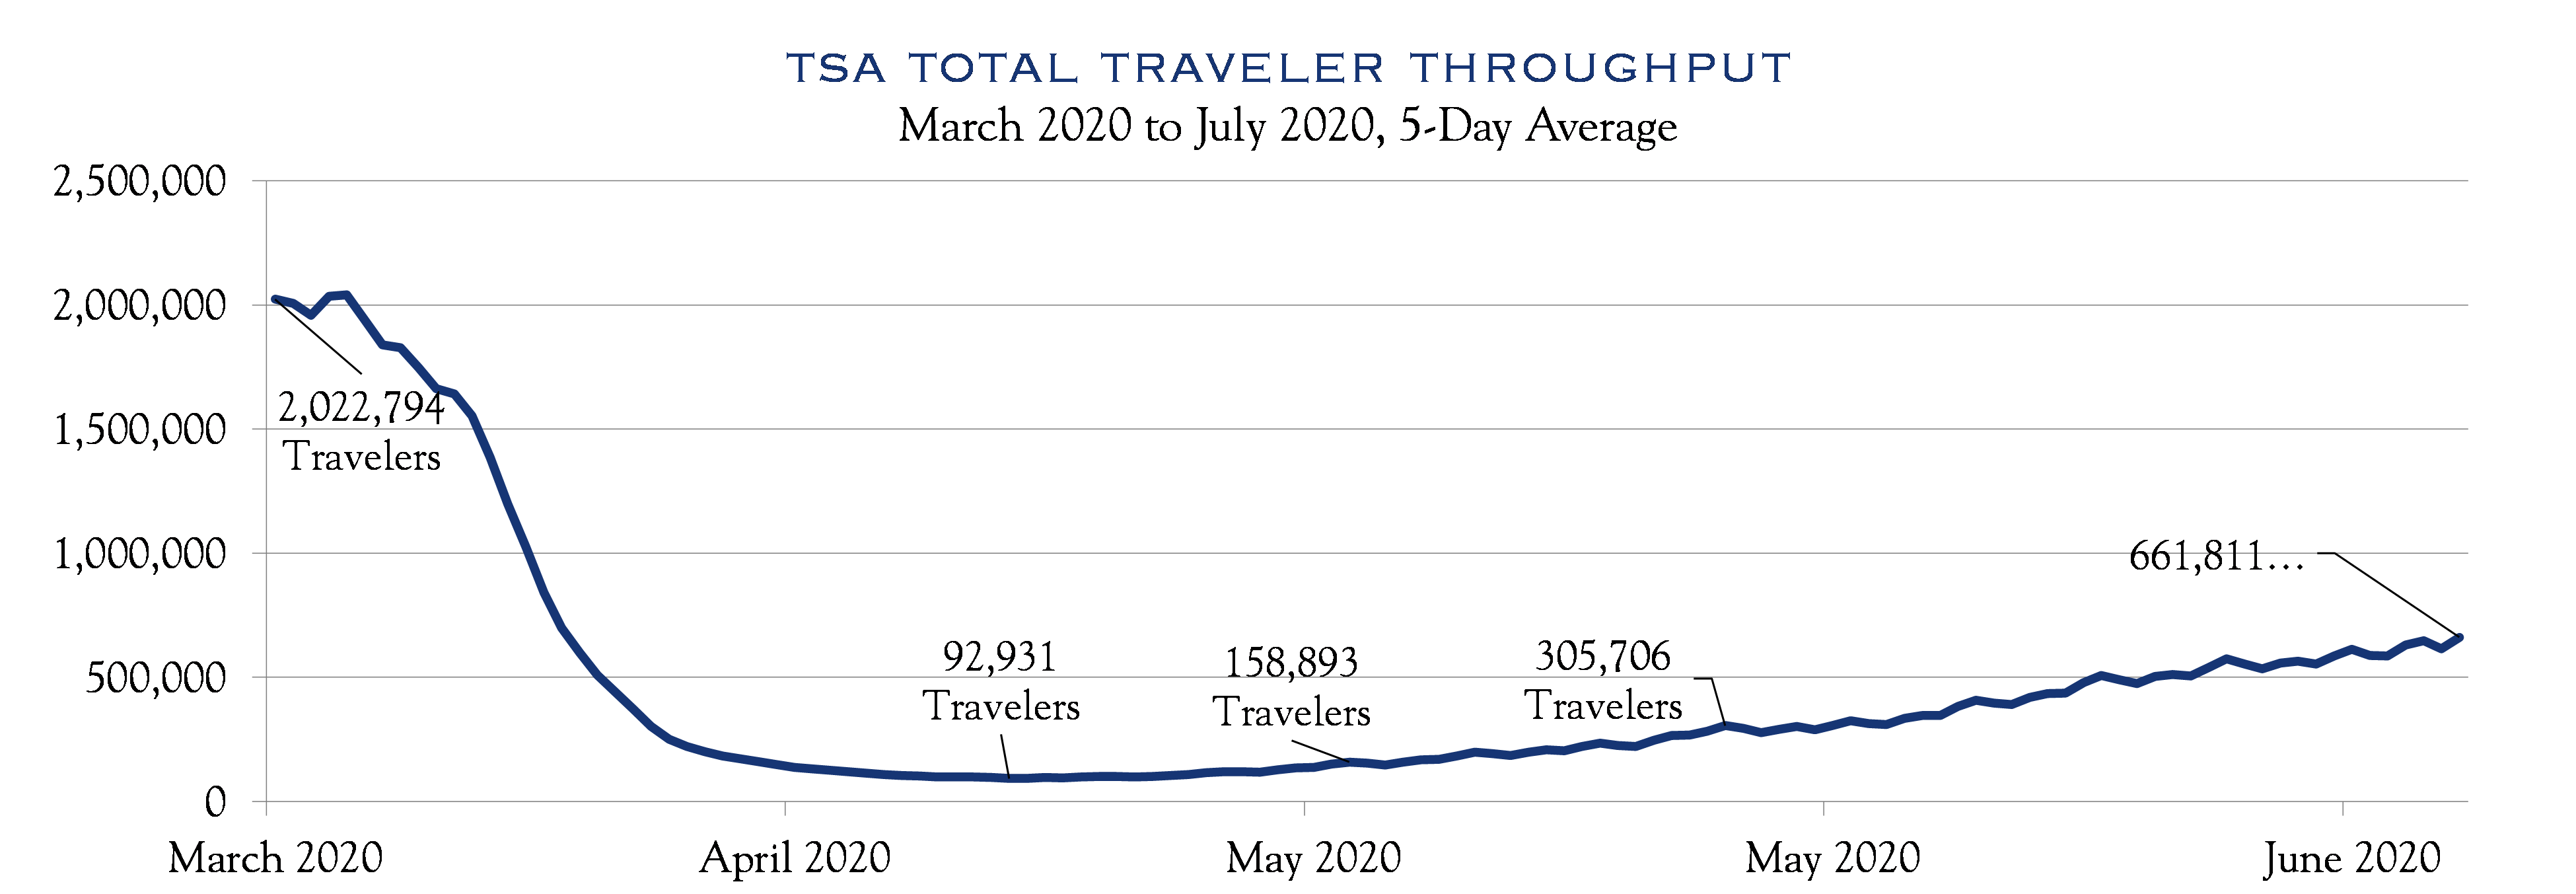
Source: TSA
TSA airport checkpoint data provides a good, non-traditional read on a highly COVID-sensitive industry. As such, this metric helps assess how the hardest hit industries may be faring nationally.
While certain industries may be forever changed, aggregate economic activity will recover. Presently, consumer spending, the New York Fed economic activity gauge, and rebounding short-term economic measures provide our signposts for the current level of activity.
The consumer represents about two-thirds of U.S. Gross Domestic Product (“GDP”). Consumer spending data from multiple sources reveals that consumer spending is currently 85-90% of pre-COVID levels. As an approximation of GDP, consumer activity down −10% equates to a GDP hit of approximately −6.5% from pre-COVID levels.
U.S. Economists take an unconventional approach to GDP reporting conventions and report U.S. GDP using Seasonally Adjusted Annual Rate (“SAAR”). This approach takes a decline, such as −6.5% and then annualizes this figure, assuming the drop continues across four quarters. For this reason, many economic reports mention GDP levels declining −25-40%, even though the actual decline is much less.
With interest rates at historic lows, mortgage applications have improved, home prices remain firm, and the housing market remains on solid ground. Both retail sales and housing illustrate a key difference from the 2008 Global Financial Crisis (“GFC”). As we have previously observed, the COVID crisis is more akin to a natural disaster, where demand is disrupted for a time. In contrast, the years leading into the GFC saw demand pulled forward, making an eventual recovery much more difficult.
The longer-term changes from COVID are likely to involve substitution effects or creative destruction, primarily around technology vs. physical presence. The concept of creative destruction in an economy was put forth by the economist Joseph Schumpeter, who showed that change, painful as it is, can be additive over the long haul—creating improvements in efficiency and unlocking new potential. Change creates risks, but also opportunities. For this reason, we favor bottom-up, fundamentally driven security selection as a means of successfully navigating this rapidly changing economy.
Compared with prior crises, the government response has been different as well—quicker and more forceful—supporting a broad wave of monetary and fiscal stimulus. A core tenet of government action has been to protect incomes and balance sheets as the economy trudges through COVID valley.
While jobs have been destroyed or temporarily disrupted on a massive scale, there are two important offsets. First, a large portion of job loss affected lower-paid segments of the employment markets. While incredibly painful for those individuals, the aggregate effect on income and spending is less than job loss figures would imply. Second, a massive amount of deployed stimulus has offset income losses. Much of that support, such as the expanded unemployment benefits under the CARES Act, will expire at the end of July. While politics are inherently unpredictable, an election year will likely result in some form of support for those hurt from COVID-caused job losses.
The Fed and Treasury have been staggeringly supportive, even though some measures have not yet been fully implemented. Credit markets remain stable and well-functioning, with funding broadly available. Existing and authorized facilities have not been fully utilized. If COVID-caused economic stress lingers, the Fed appears to have the wherewithal to continue supporting significant balance sheet flexibility.
Taking a broader look at the economy, the New York Fed produces a weekly economic gauge based on inputs ranging from consumer and jobs data to steel production, fuel usage, and electric output. The data shows improvement from a trough −11.5% drop in GDP to a current −7.4% decline. Notably, this figure compares well to our consumer-based estimate above of a −6.5% GDP decline.
These techniques show an economy running at about 85-95% of pre-crisis levels, with wide dispersion across segments. Unsurprisingly, restaurants, travel, and similar activities are down much more, while areas such as software services are running at near record high levels. Our view is that GDP is currently about 90% of pre-COVID level on a run-rate basis and will fully recover, or nearly so, sometime in 2021. This leads to our assessment of future earnings.
Earnings Outlook
Three key assumptions must be made to assess the 2021 earnings outlook:
- The status of COVID recovery will largely define the economic backdrop, which will determine top-line revenue growth.
- The political environment may play a significant role as control of Congress and the Presidency will influence tax and regulatory policy.
- An evolving consumer and social backdrop will affect the job market, wages, and earnings.
We think the economy will improve in 2021 to near 2019’s level of activity based on estimates from the Federal Reserve, consensus projections from economists, and our own math on the current economic run rate. We estimate a current starting point of 90% of 2019 GDP, mentioned above. The Fed forecasts a central tendency to GDP at a level of 98% of 2019, while consensus expectations from economists are for just over 100%. Come 2021, the economy is likely to be running at a rate similar to that of 2019.
It is easy to size up the current environment and assume that an earnings recovery will take a long time. Yet it is instructive to consider timelines. The wrath of COVID began in mid-March, about 125 days ago. Any assessment of 2021 must acknowledge the remaining 180 days in 2020, not to mention the entirety of 2021. If we are at the halfway point of the COVID crisis, all of 2021 should look quite compelling. If instead, we are only one quarter in, recovery should set in around mid-2021.
Estimates for second quarter ended June 30th show earnings of $23 per share, a decline of −44% vs. the same quarter in 2019. While 2Q earnings season is just approaching, precise results will be of less interest than the recovery path and an outlook for upcoming quarters. Earnings for the full calendar year 2019 for the S&P 500 were $157. Applying our approximate GDP run rate of 90% to earnings allows creation of a simple estimate for the four forward quarters from July 1, 2020 to June 30, 2021. This approach yields a blended earnings figure of $141 per share (90% of 2019 earnings of $157). Our estimate is conservative compared with a consensus forecast for $155 over the same time horizon. However, markets themselves tend to look forward, or “discount” earnings, about six months into the future.
Looking ahead, markets are being valued on the basis of expected 2021 earnings. Consensus estimates are for $162 per share, representing a 3% increase over the baseline, pre-COVID calendar year of 2019. Our estimate is a bit lower. Overall, if economic activity recovers as we expect, and election year politics remain as unpredictable as ever, we anticipate 2021 earnings to be in a fairly tight range as compared with pre-COVID 2019. With at least two quarters of 2021 likely to reside in a post-COVID world, we think the bias is slightly to the upside for economic activity. Political influences have the potential to trim margins, while wages and capacity utilization are neutral to favorable for profits. Our expectation for earnings is $158 for 2021, the mid-point of a range of $150-165.
Pondering Politics
Current polls and election prediction services indicate high probabilities of a trifecta for the Democrats—holding the House, winning the Senate, and winning the Presidency. Beginning in early June, sites such as Predict It have shown a continuous increase in odds for this outcome. While conventional wisdom holds that this outcome may mean a less favorable tax and regulatory environment, there is far too much time and uncertainty in the election process to assess the probability of a worsening tax and regulatory regime. Election year outcomes require correctly guessing a double coin toss. First, correctly gauging election results, and second, correctly predicting legislation and policy. For now, our base case outlook encompasses a range from continuation of the status quo through a potential $9-10 hit to earnings from a partial reversal of corporate tax rates, as outlined by candidate Joe Biden. Thus, an assumption of a $0-10 hit to earnings from the unpredictable political environment seems reasonable. We claim no special insight into election outcomes and do not yet assume a hit to earnings as we await a more robust election year exchange of ideas and platforms and more seasoning of polls and predictions.
Valuation & Allocation
In the newly released book, The Biggest Bluff, Maria Konnikova discusses the role of luck and skill using an example from the world of poker. She cites a review of hundreds of thousands of poker hands, showing, incredibly, that the best hand was the winning hand only 12% of the time. Similarly, portfolio construction requires an assessment of the current state of affairs, reasonable assumptions regarding the future, and discipline playing the hand dealt. This enables evaluation of relative value across asset classes and assembling a portfolio reflective of client objectives, current conditions, and outlook.
At present, we see a benefit from conservative short-duration assets serving as ballast in a portfolio. We believe careful credit selection allows for value creation within both the corporate and municipal bond markets. We continue to slightly overweight equities, due to both a compelling dividend yield and our cautiously optimistic earnings outlook over our three-year time horizon.
The current trade-off between risk and return is well captured in a simple comparison of stocks and bonds. The interest rate on the U.S. 10-year note is acknowledged to be the standard risk-free rate. Currently this risk-free rate is just under 0.70%, a very minimal return. In seeking higher return potential, risks can be taken in either the credit or equity markets. Corporate bonds of investment grade through high yield offer potential for yields in a range of approximately 2.5% to 6.5%.
Regarding equites, valuation is a critical component of expected return analysis and we believe inflation and interest rates are essential influences on valuation. The chart below illustrates this relationship: the dark blue line (Price/Earnings) remains elevated, when the light blue line (yields) is low.
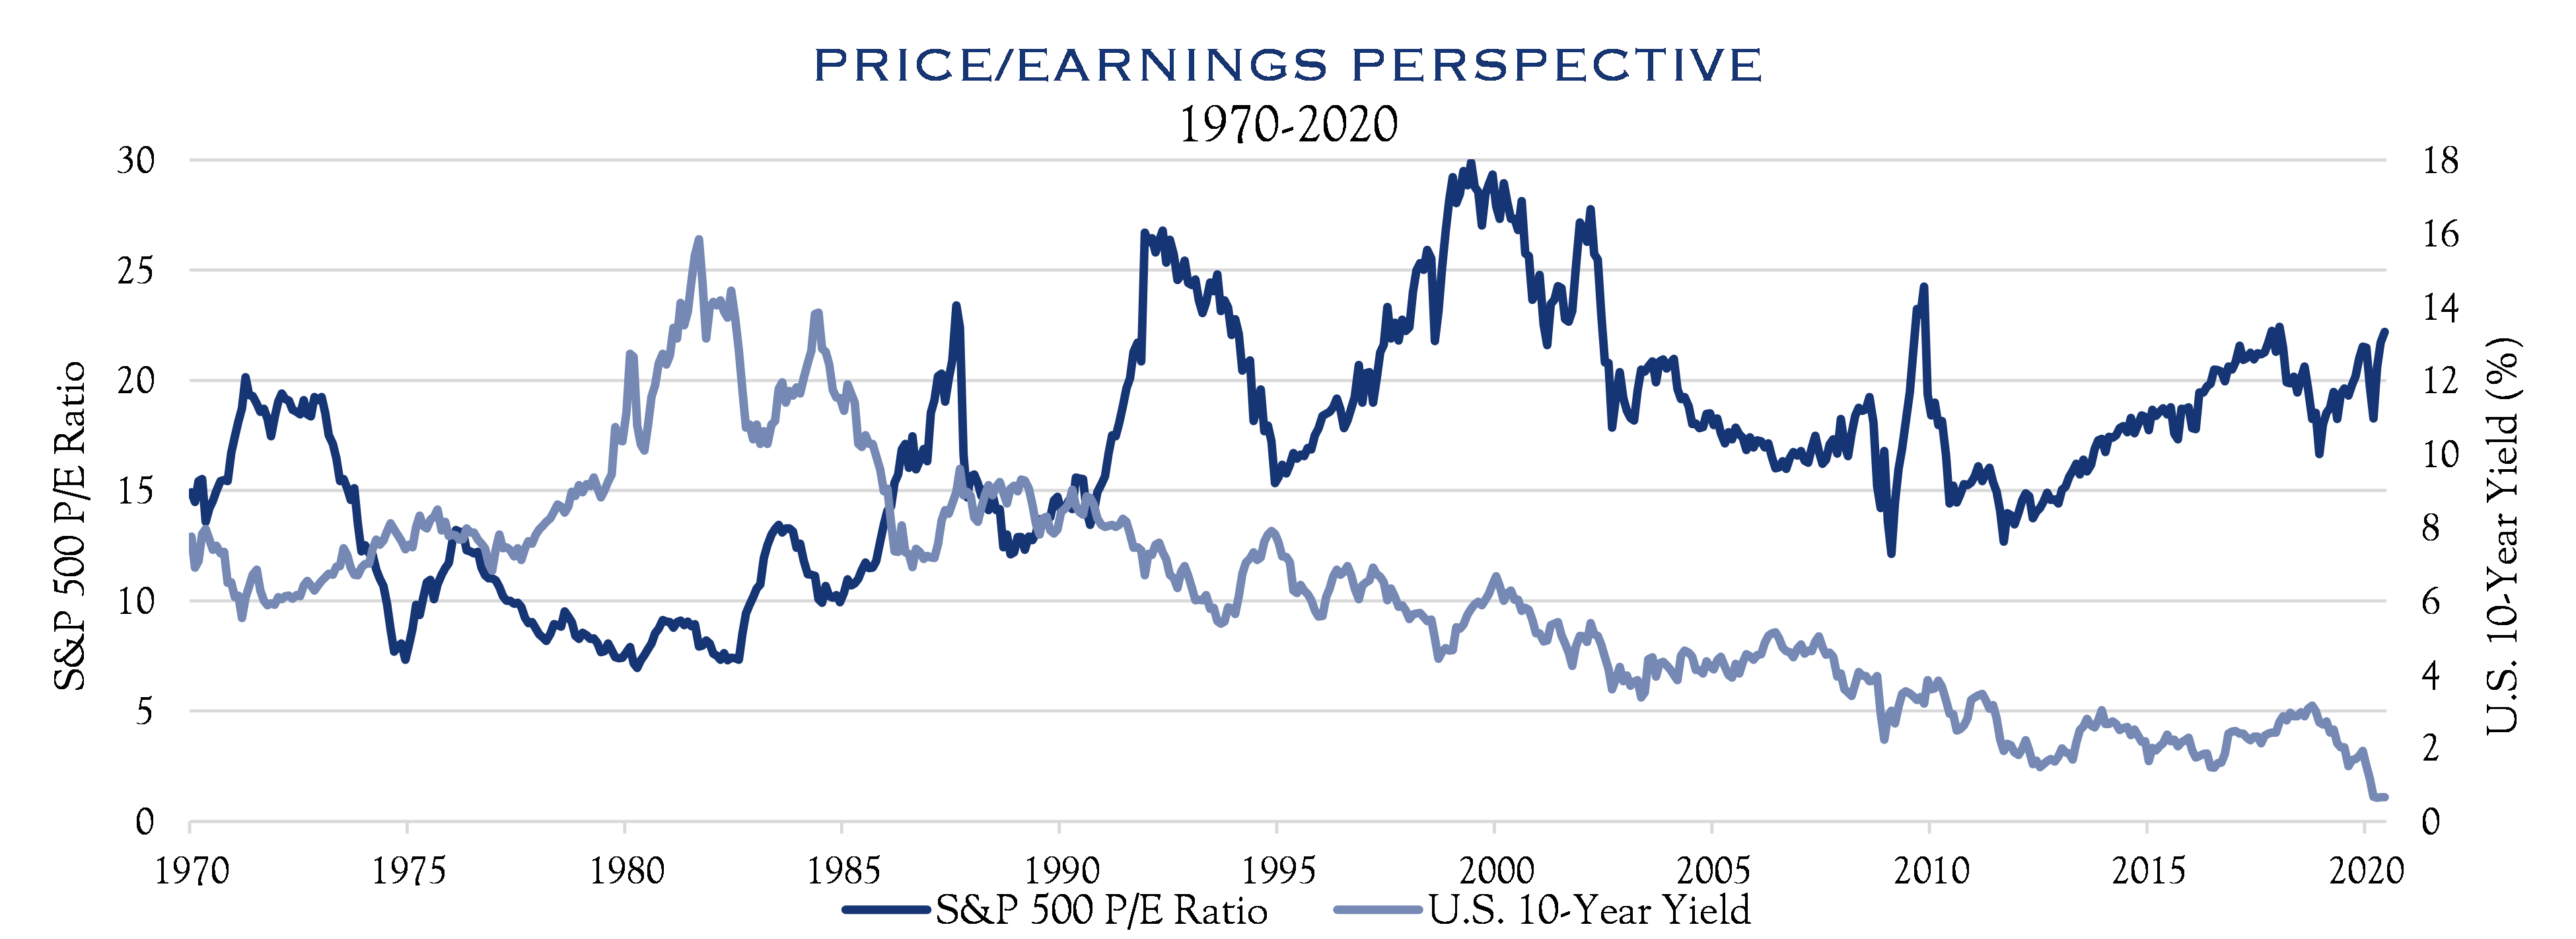
Source: Bloomberg
The S&P 500 has traded within a range of 2800-3200 since mid-April. Current valuations reflect a reasonable and pragmatic view, consistent with our current earnings expectations and a Price/Earnings ratio that has remained stable around 20x over the past five years. We think the post-COVID path we outlined for earnings will see recovery in 2021 followed by below-trend earnings growth of 5.0%, paired with a 2.0% dividend and stable-to-slightly rising valuations. Together, we expect a 7.5% annualized total equity return over the next three years.
Absent Inflation
Inflation has been absent by most measures and has not bothered to make an appearance via video call, although it does crop up in certain areas such as healthcare. This absence of inflation carries benefits that cannot be overstated. For many years, inflation was the scourge of investors, decimating real returns while coinciding with high interest rates that served as a compelling risk-free alternative to equities. The massive COVID stimulus from governments and central banks around the world has many wondering if inflation will once again rear its ugly head.
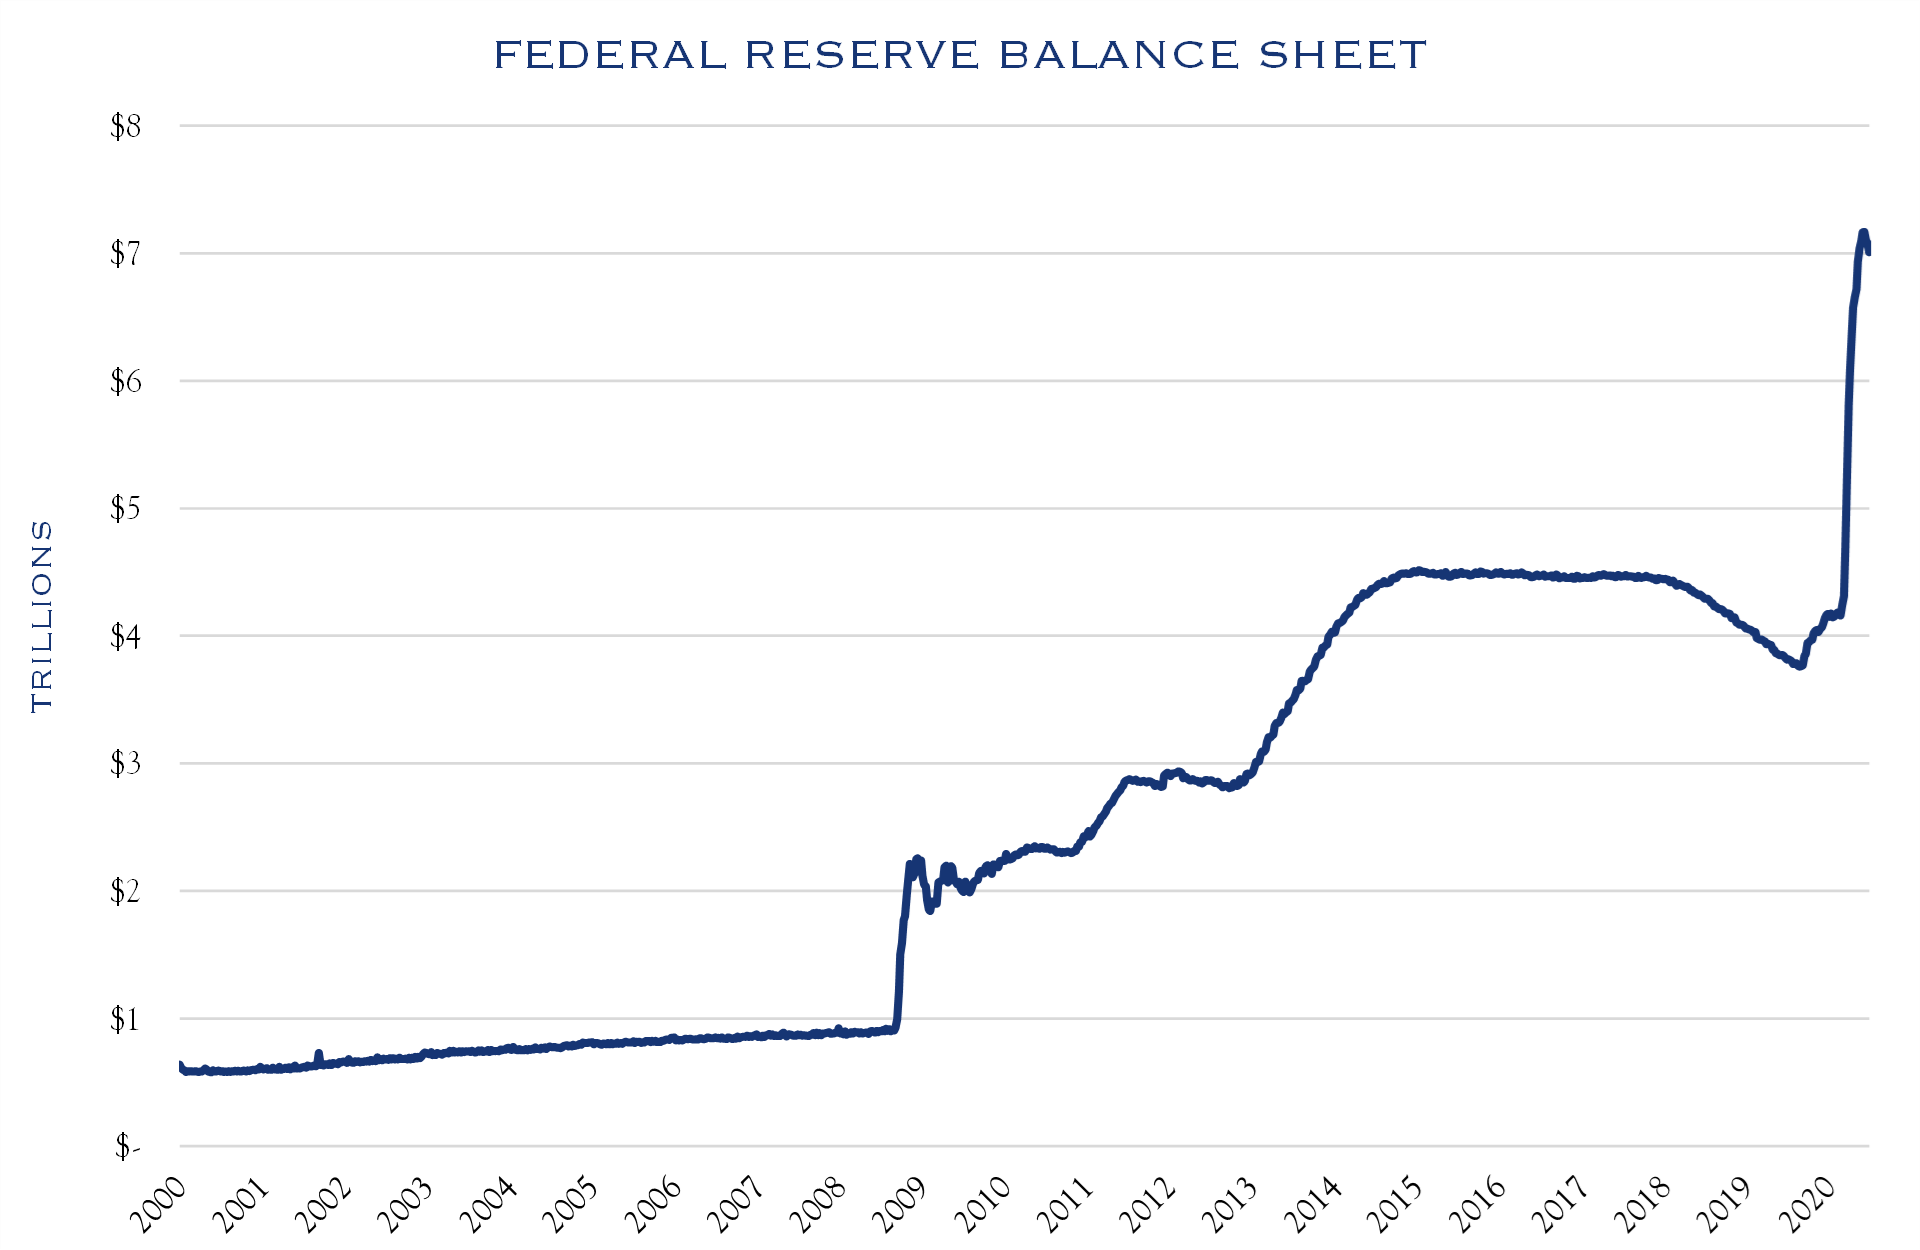
Source: FED, Macrobond
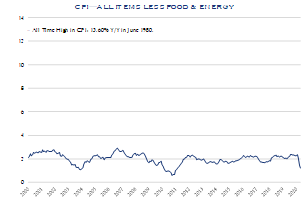
Source: Bureau of Labor Statistics (BLS), Macrobond
Our short form analysis is that unless the money is spent in an inflationary fashion, it won’t create inflation. Japan has been the primary example of this scenario. Despite massive stimulus over the years, cash is generally hoarded in Japan—both in personal savings and on corporate balance sheets. In the U.S. 2008 financial crisis, money went toward the support of bank balance sheets and thus didn’t circulate in the “real economy” in an inflation-inducing manner. A similar dynamic is likely currently at play. Funds are mainly headed toward balance sheet support in the corporate sector, bank and non-bank. However, even if funds moved into the “real economy,” it is challenging to picture a level and type of spending that creates significant inflation risks. Consider the low rates of capacity utilization, loose labor markets, and a globally competitive and transparent price discovery process for all manner of goods and services. The abundance of choice for buyers, along with the “inflation peace dividend” from Paul Volcker’s victory over inflation, means that inflation expectations remain strongly anchored for the foreseeable future. While this remains an issue worthy of careful ongoing scrutiny, we see no near-term inflation threat.
Fortitude and Patience
The explorers Lewis & Clark faced a journey of over two thousand miles across unexplored and risky territory. Their journey by river also created navigational and propulsion challenges. At times, lacking a current, and facing many rocks or trees, the pace slowed to a crawl. Markets also generate a mix of swift, favorable currents as well as great challenges. Investors must meet these challenging times with fortitude and patience. Consider the stunning difference in outcomes between staying the course through the COVID crisis as compared with missing a handful of the market’s recent best days.
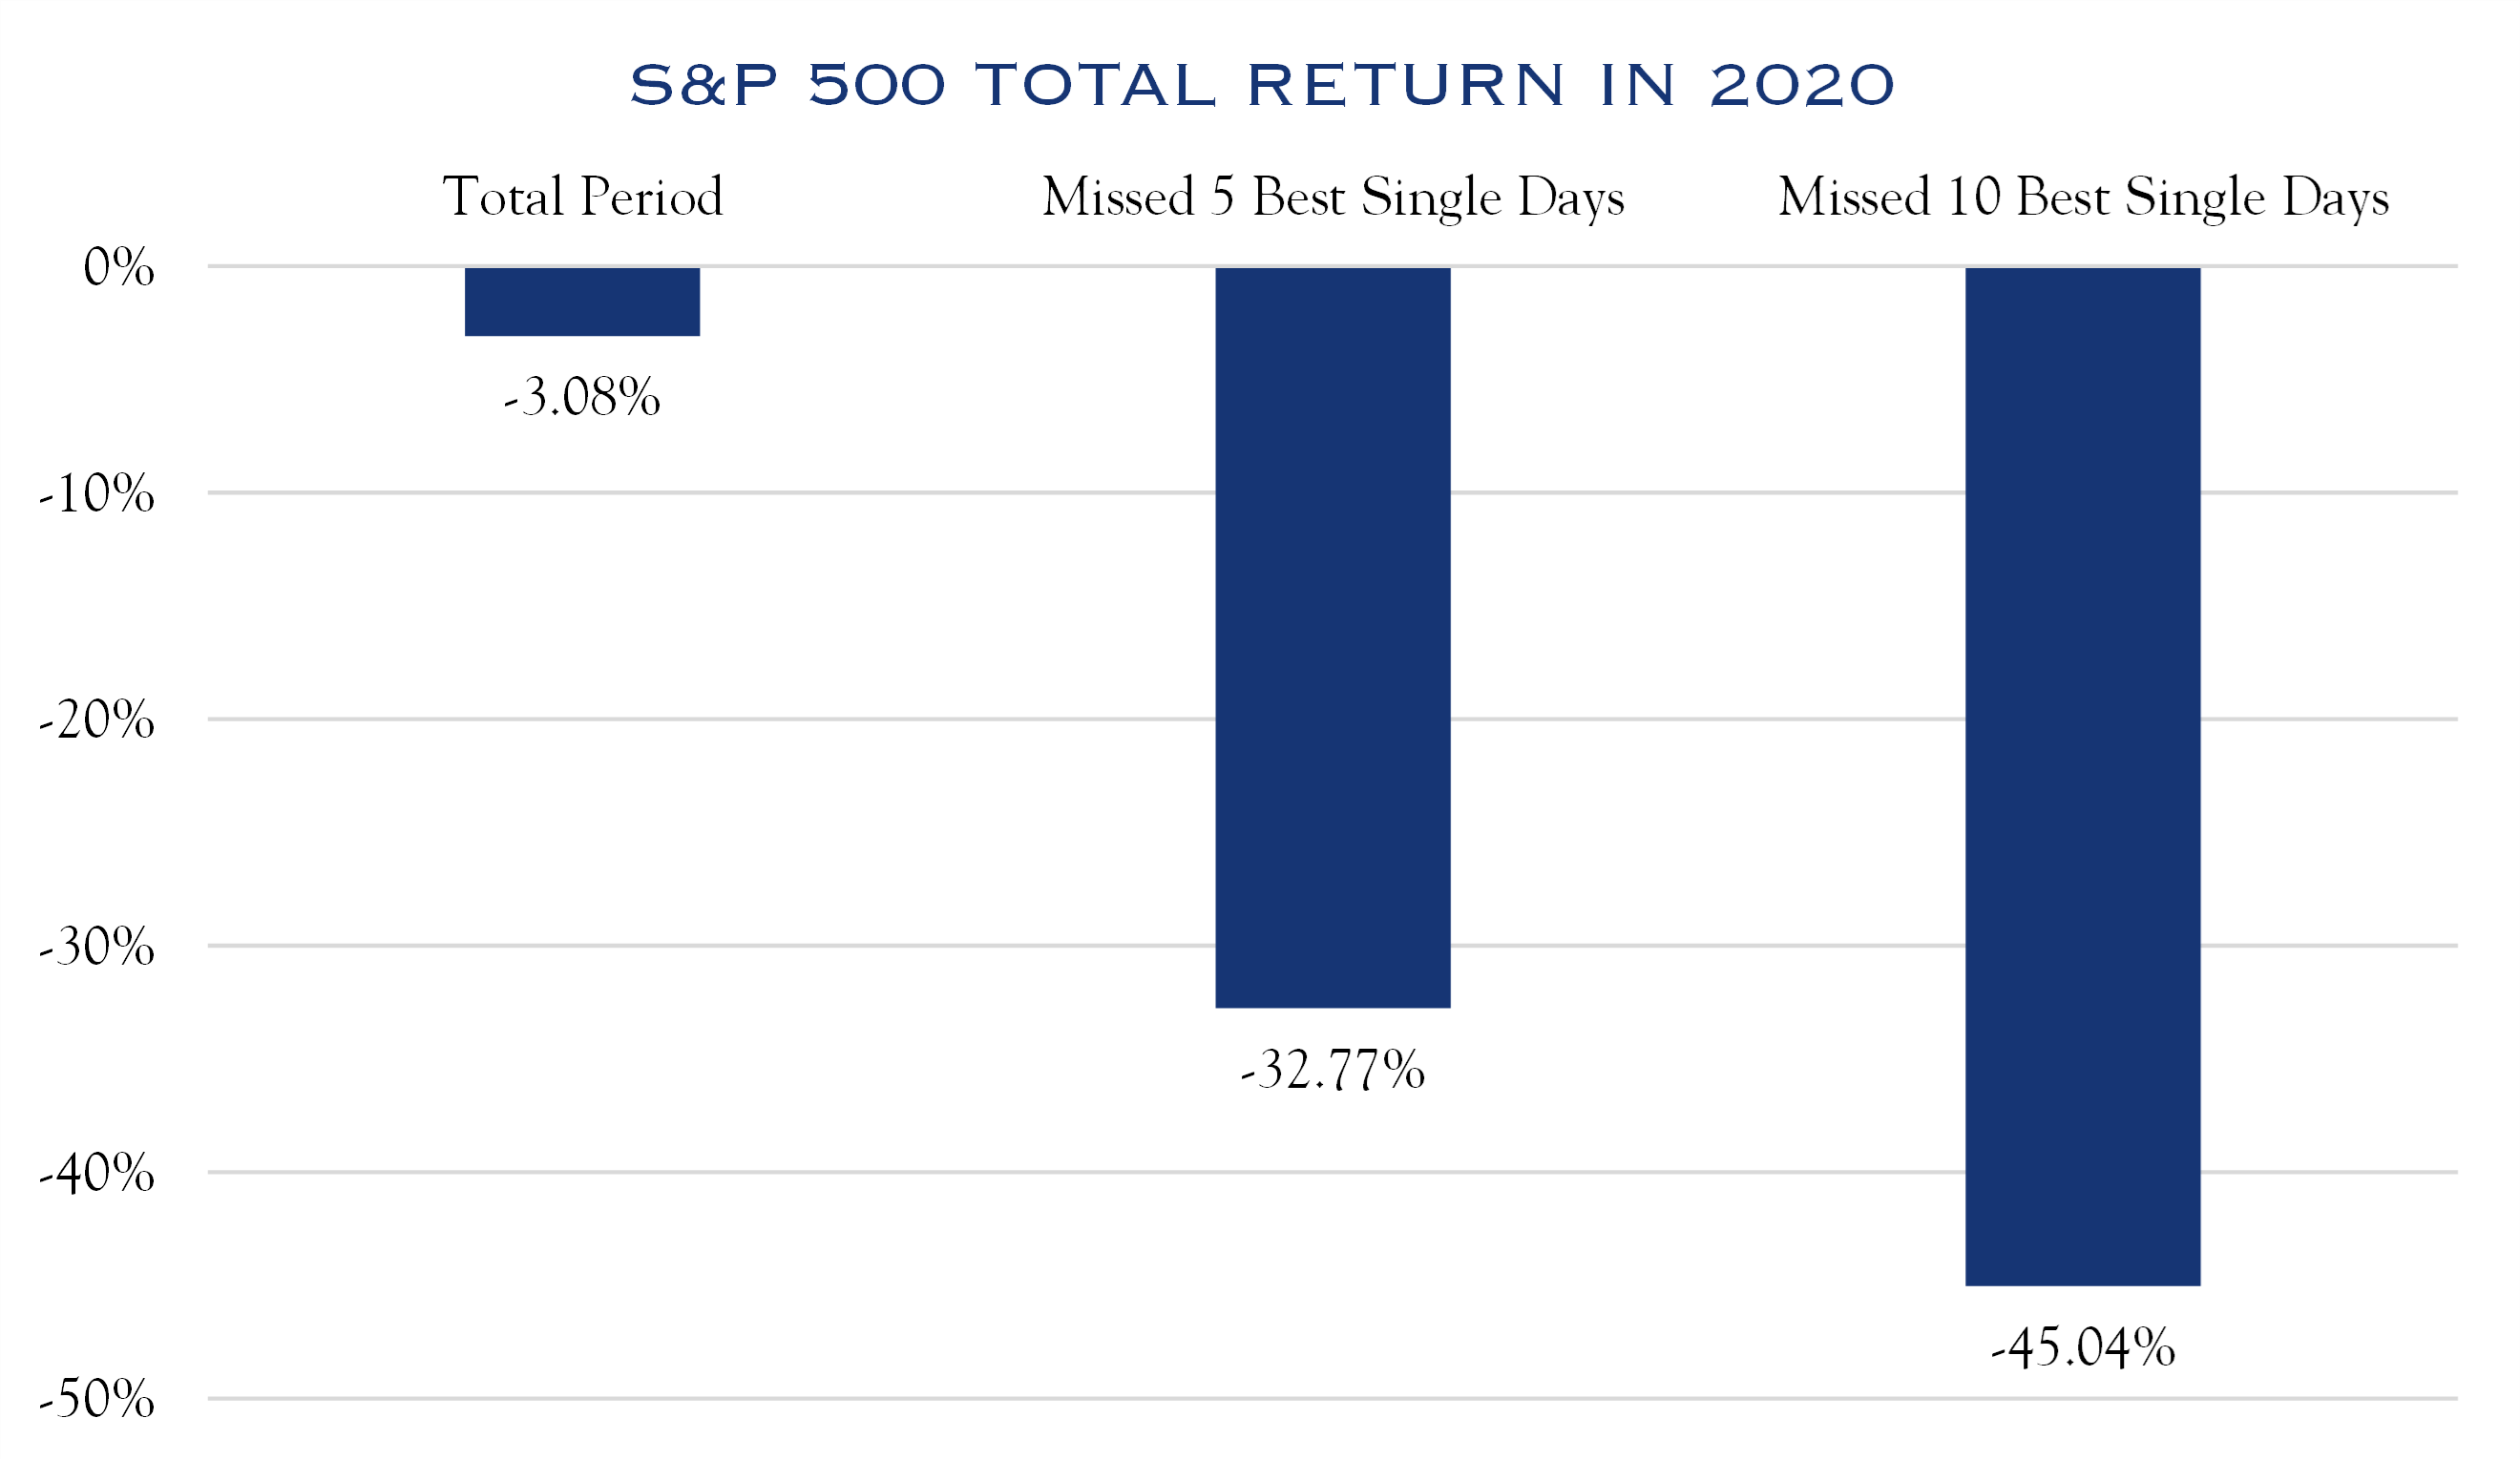
Note: Total Period is from 12/31/2019 to 6/30/2020
Source: Bloomberg
Another important characteristic of COVID is the disparate effect on regions, individuals, and industries. Markets have largely reflected this, with dispersion running high across primary indices.


Source: Bloomberg
It is well known that past performance is not indicative of future results. Economies evolve over time and COVID won’t always be the primary influence on markets. Thus, what has worked in the past may not work in the future. This state of complexity and change, as well as ongoing volatility and dispersion are why we continue to abhor market timing while advocating for skilled active management.
Although COVID has disabled our economic navigational systems, we are gaining a better understanding of both our current conditions and our direction of travel. Certain segments of the economy remain badly damaged, while others have weathered the storm. In aggregate, circumstances are significantly improved over the past 90 days, though far from normal. Markets remain focused on the direction of the economy rather than the location, while policymakers indicate continuing support for balance sheets and incomes during this recovery process. Though it will be a bumpy ride, we believe the path forward continues to be one of improvement and recovery for both the economy and earnings. This ongoing recovery in aggregate metrics will mask significant divergences in outcome across industries and companies. Volatility and disperse outcomes are strong arguments for a patient, risk-tolerant approach, reliant on active management for security selection. We think the ongoing COVID recovery and our forward-looking estimates regarding the economy, earnings, and valuations justify this approach and that investors with a reasonable time horizon will be rewarded for their patience.
This communication contains the personal opinions, as of the date set forth herein, about the securities, investments and/or economic subjects discussed by Mr. Teeter. No part of Mr. Teeter’s compensation was, is or will be related to any specific views contained in these materials. This communication is intended for information purposes only and does not recommend or solicit the purchase or sale of specific securities or investment services. Readers should not infer or assume that any securities, sectors or markets described were or will be profitable or are appropriate to meet the objectives, situation or needs of a particular individual or family, as the implementation of any financial strategy should only be made after consultation with your attorney, tax advisor and investment advisor. All material presented is compiled from sources believed to be reliable, but accuracy or completeness cannot be guaranteed. © Silvercrest Asset Management Group LLC

