
Recently, Harvard students wrote an angry editorial in their school newspaper, The Crimson. The source of their outrage wasn’t racial injustice or an unpopular war. Instead, they demanded Harvard’s endowment start earning a higher return on investment, to provide for the school’s future needs.
If that’s not a sign of unusual times, I don’t know what is. Savers of all stripes—from student activists to retirees to Silvercrest clients—are wondering what low or negative interest rates mean for their future plans and well-being and whether, amid uneven economic growth, equity returns can hold up. We believe it is possible to navigate this challenging environment successfully, as long as investors have realistic expectations and keep their eyes on the long term.
Where Is My Friend, The Trend?
“The trend is your friend” is one of the old standbys of investment advice. Yet looking at markets and at the latest economic data, it’s hard to see much of a trend at all. Recurring stock market sell-offs (and “flights to quality” in bond markets) have not led to a sustained downturn, nor have stuttering growth and worrisome data points translated into an actual recession.
Investors naturally wonder exactly where we are in the business and market cycle. Normally, different elements of the economy tend to rise and fall in tandem, because they are interconnected. First, a number of positive factors coalesce and reinforce each other, giving rise to a “boom” (e.g., new orders cause businesses to invest and hire more people, boosting consumer confidence and spending on homes, cars, and all sorts of things, boosting corporate earnings and share prices). Then a number of negative factors arise and reinforce each other, causing a “bust” (e.g., inventories pile up, causing companies to pull back and lay off workers, who now spend less, undercutting confidence in growth and equity valuations). Each cycle’s dynamic is a bit different, but normally we look for a confluence of factors pushing in one direction or the other.
That’s not what’s been happening lately. Each month, each quarter we’ve watched different elements of the economy wax and wane—but out of sync with each other. At the start of the year, the housing market was going strong, while manufacturing had entered a serious slump; today, manufacturing is on the mend, but housing has cooled. Consumer confidence is riding high, even as business confidence is in the dumps. The result is an economic engine that’s always running on one, two, or sometimes three out of four cylinders, neither roaring to life nor conking out completely.
The picture on the next page shows what it looks like when you have different sound or energy waves out-of-cycle with each other, sometimes compounding and sometimes cancelling each other out.
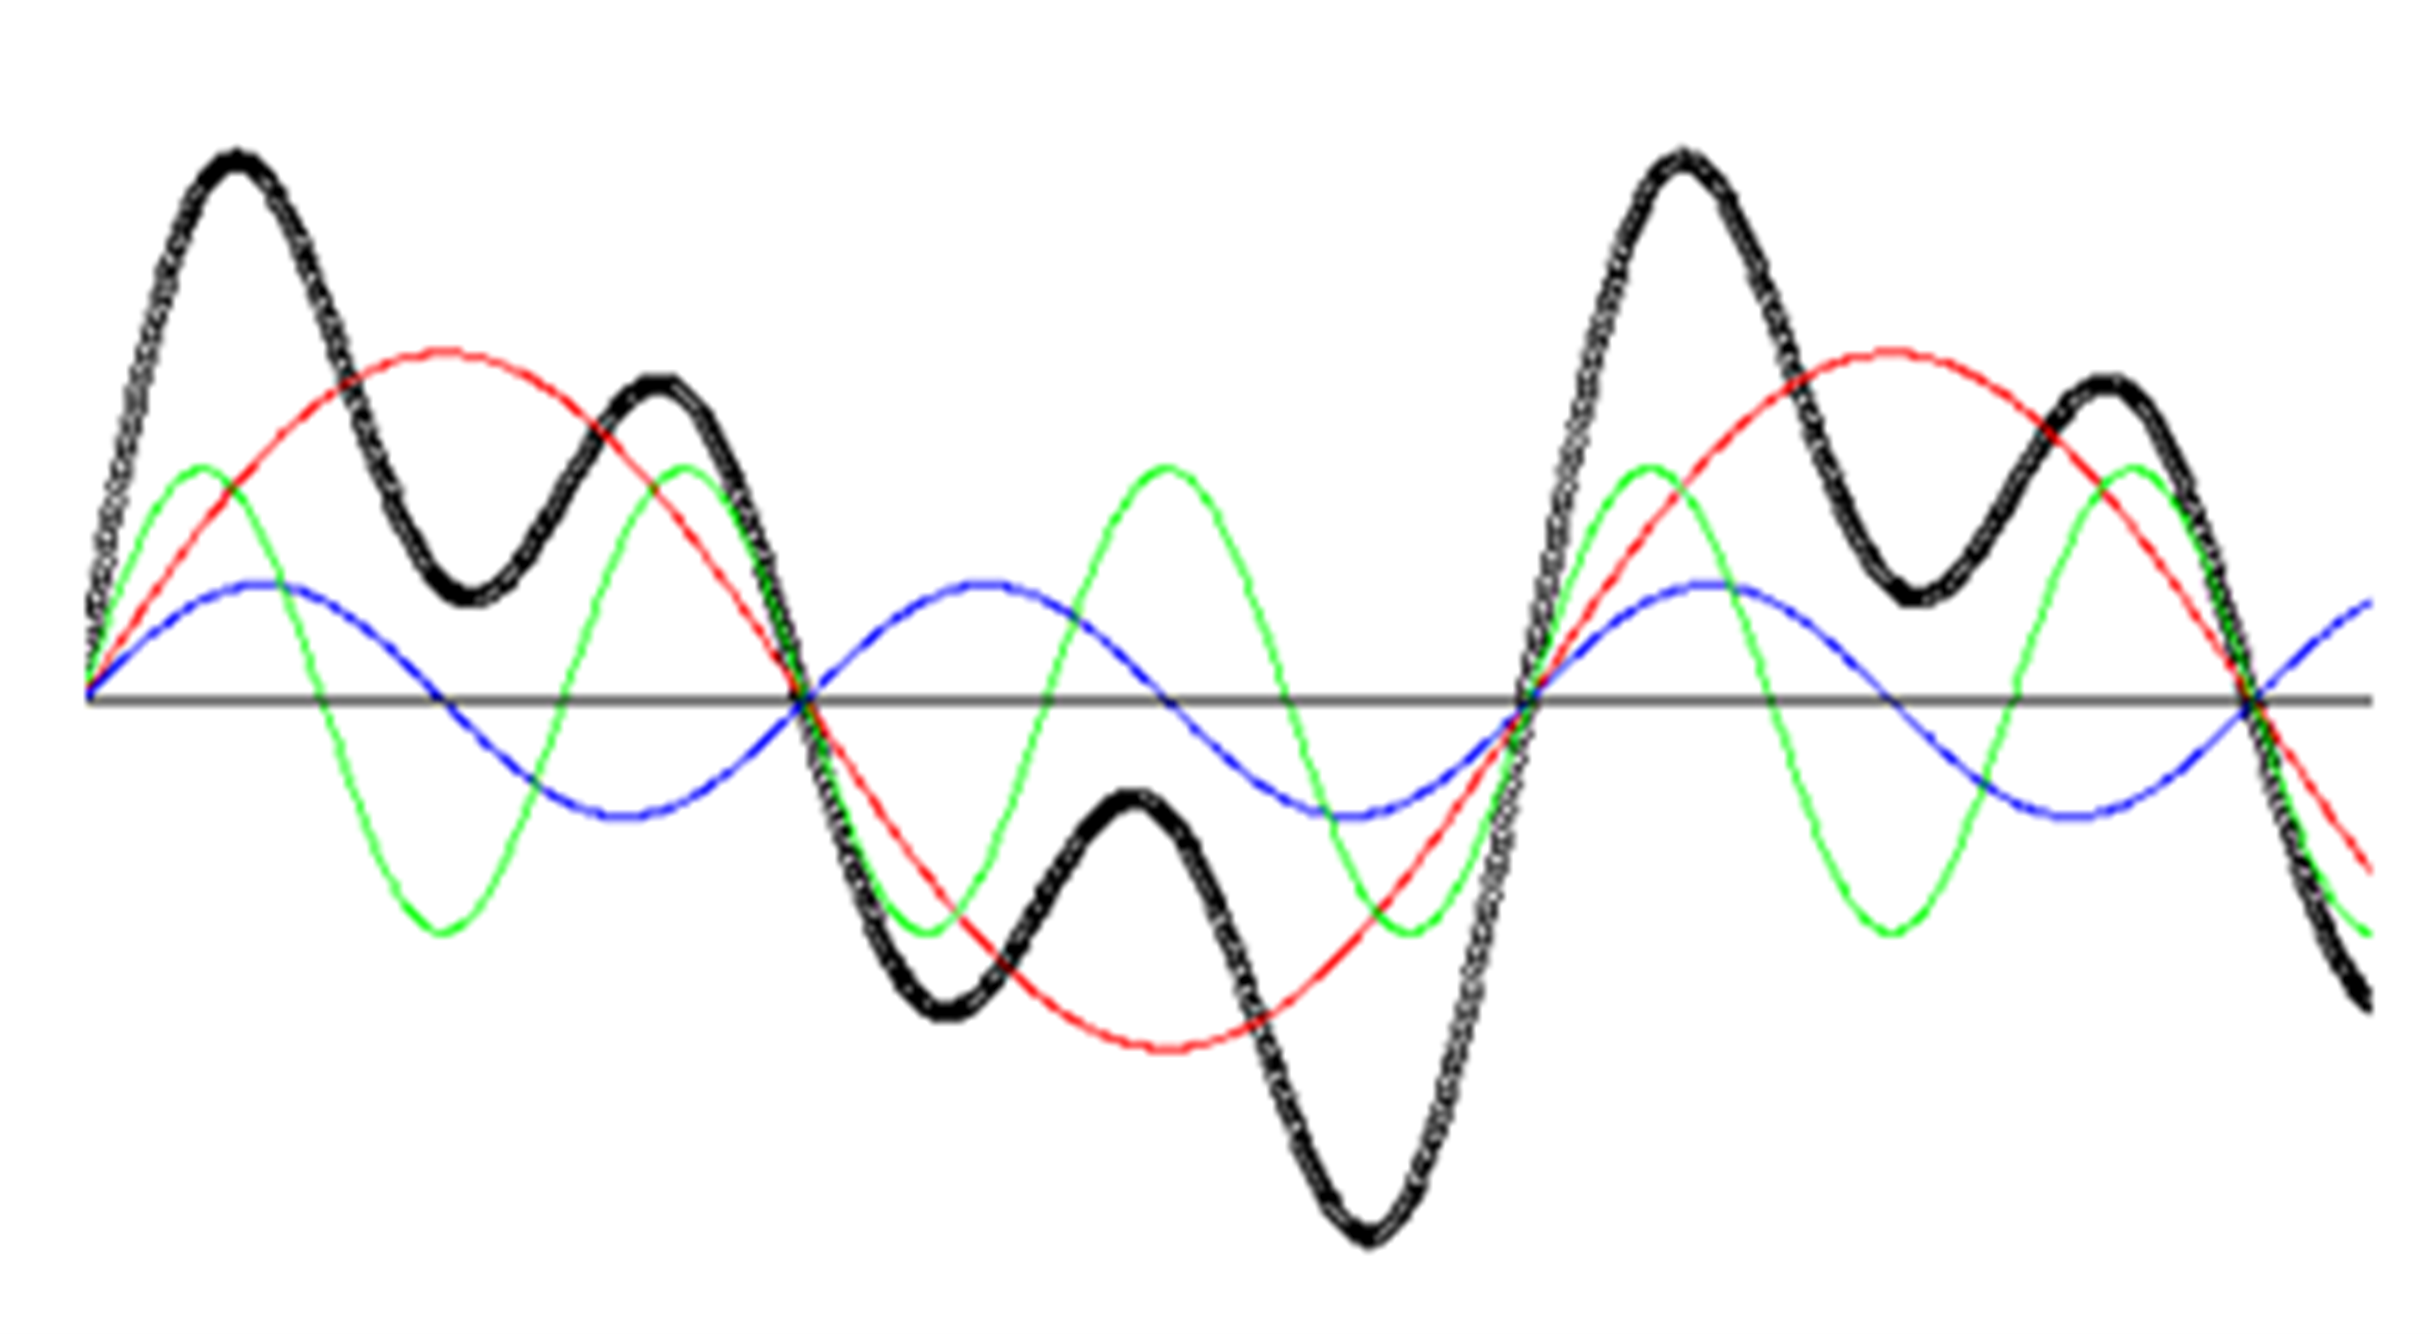
The thick black line is the resulting pattern, and—if you take the centerline as an average rate of 2% growth—it looks remarkably like the halting pattern of quarterly U.S. GDP growth for the past six years, shown below.
REAL GDP
Percent Change From Preceding Period
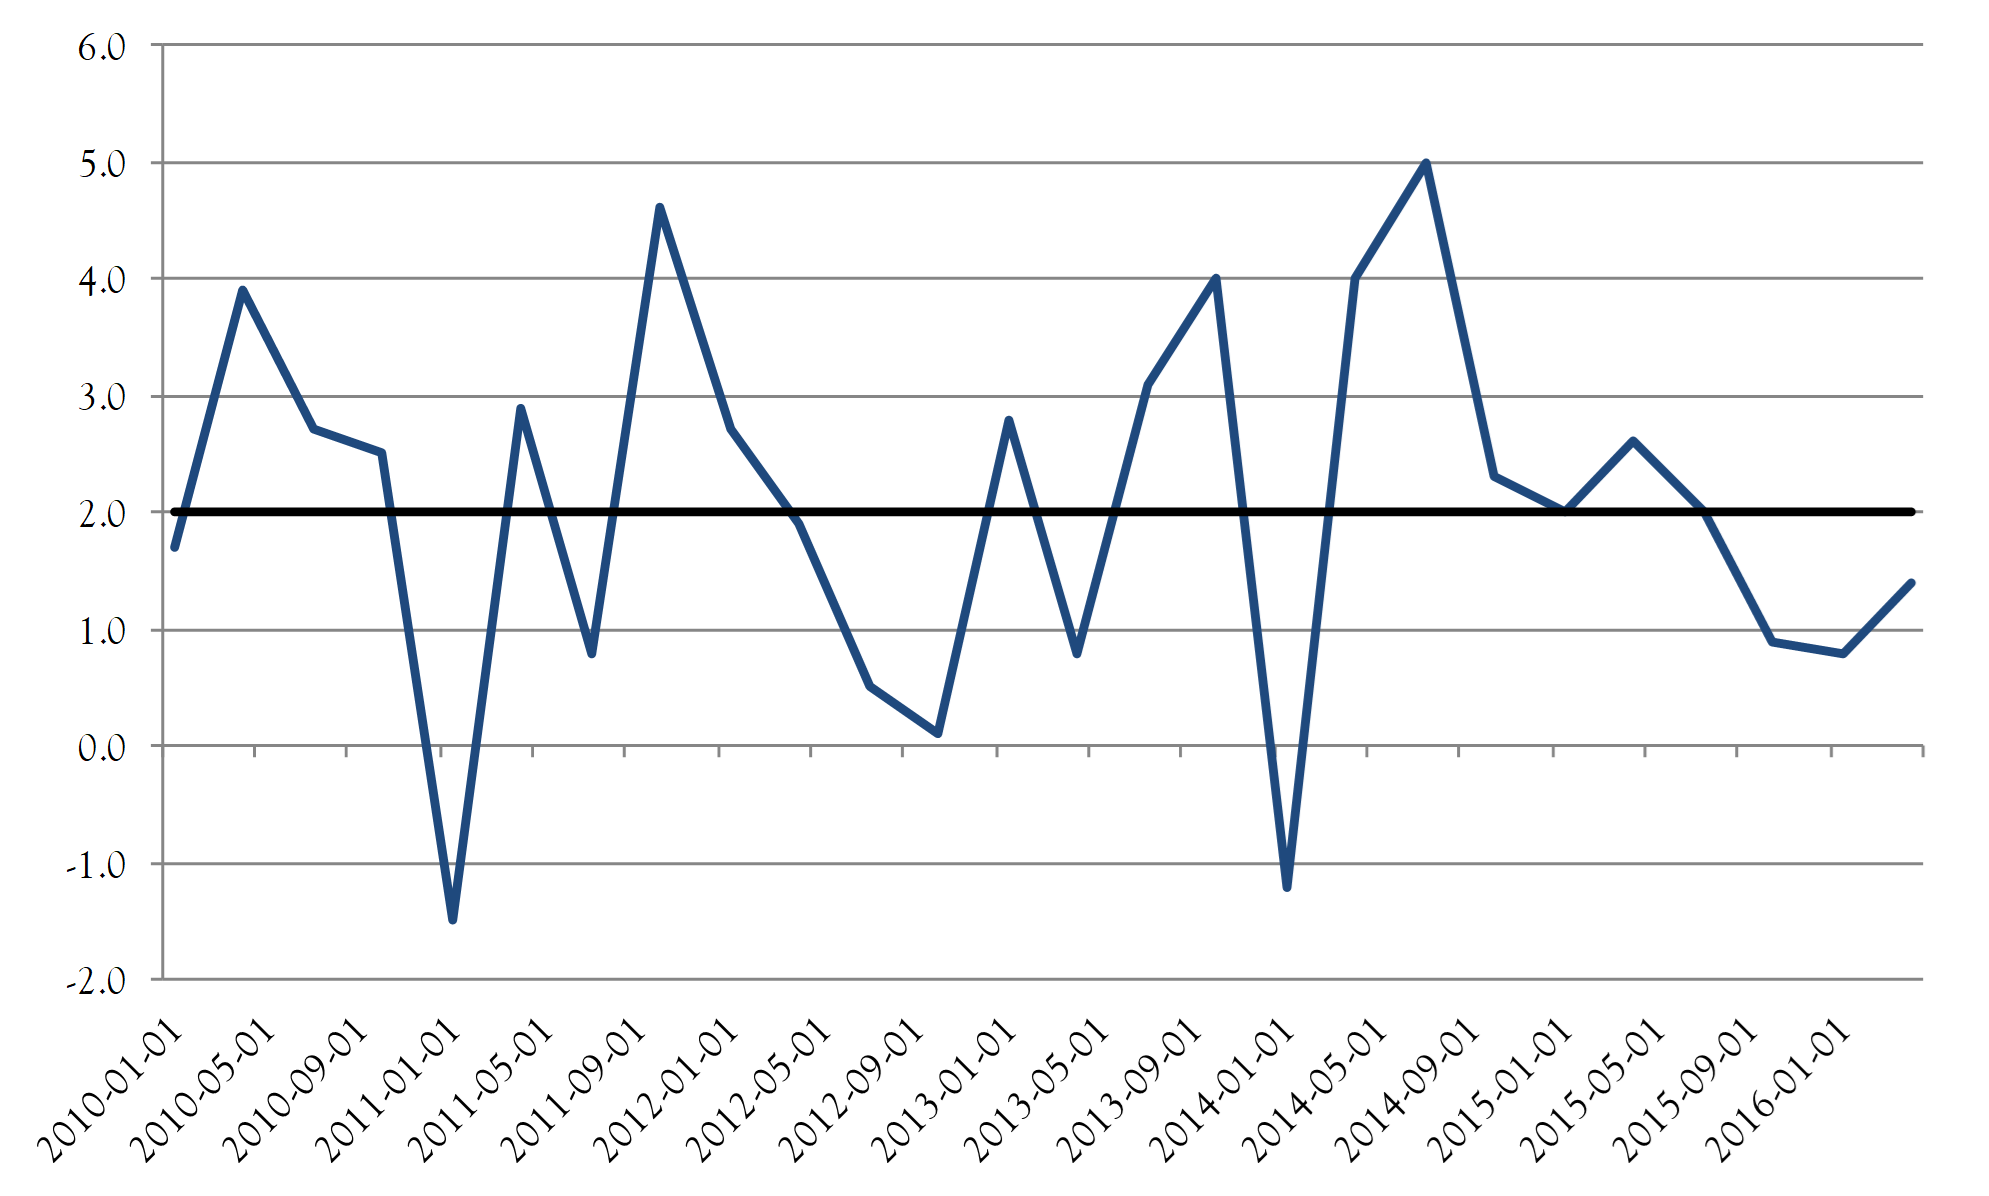
Instead of a consistent “boom” or “bust”, we could easily see one negative quarter followed, not by a recession, but a surging (and equally short-lived) rebound. Or to put it another way: trendless growth.
This pattern is markedly different from other recoveries. The table below compares the last four U.S. recoveries on the following: 1) how long did they last? 2) how many of those quarters saw at least 3% growth? 3) how many quarters saw all three domestic components of GDP (consumption, investment, and government spending) make a positive contribution to growth? and 4) how many one-quarter negative “dips” did the economy experience? The current cycle stands out by far as the most sluggish and uneven.
| Time Period | Length of Recovery in Quarters | Quarters with ≥ 3% Growth |
Quarters with C, I, and G all positive | # of One-quarter Negative Dips |
| 1982-1990 | 32 | 23 (72%) | 18 (56%) | 0 |
| 1991-2000 | 39 | 26 (81%) | 20 (51%) | 0 |
| 2001-2007 | 25 | 12 (48%) | 12 (48%) | 0 |
| 2009-today | 28 | 7 (25%) | 6 (21%) | 2 |
Why is the U.S. economy behaving this way? We can think of two reasons. First, the trauma of the U.S. banking crisis, followed immediately by the Euro crisis, had a lasting impact on people’s behavior, resulting in a slow and shallow recovery. Rather than leveraging back up, companies and households continued to deleverage. For the same reason that positive factors never coalesced into a “boom”, the usual excesses corrected intermittently, softening growth, without gaining enough momentum to trigger an outright “bust”. We’re seeing this right now with cautious businesses preemptively reining in inventory stockpiles.
Second, we’re in uncharted waters when it comes to monetary policy. Today’s real economy—with rapid globalization and technology giving rise to widening inequality, structural overcapacity, and deflationary pressure—reminds us of the late 19th Century. At that time, however, the gold standard imposed hard constraints that intensified a sharp boom/bust cycle. Since 2008, in contrast, central banks have done everything they can to soften the cycle. An extended period of zero and even negative interest rates, supported by unprecedented and unconventional monetary easing, has propped up global economies and markets without necessarily re-energizing them. We are becalmed in a sea of uncertainty, with all the familiar landmarks of the business cycle obscured in a haze of worldwide monetary easing.
Hang In There—It’s Worth It
Faced with such a murky outlook, many investors ask the following question: Given that the 12-month trailing P/E for the S&P 500 is now 22x operating earnings, 25x reported earnings—rich by historical standards—and given that we may be nearing the top of the cycle and could face some sort of market downturn in the foreseeable future, wouldn’t it be a smart move to take my money out of the stock market, stash it somewhere safe, and wait for that reset to happen? Shouldn’t I reposition myself from “risk on” to “risk off”?
Reducing risk in uncertain times sounds attractive, but it comes at a price. “Risk off” assets like U.S. Treasuries promise to pay a steady and predictable return, no matter what. In contrast, the value and payout from “risk on” assets, like a diversified portfolio of U.S. stocks, go up and down with the market. To compensate for this short-term unpredictability, investors demand a higher return over the long-term. The gap between them is called the equity risk premium (ERP).
There are times, often near the end of a market cycle, when investors become insensitive to risk. They’re willing to pay higher prices for the chance of a higher payout, compressing the equity risk premium. That’s what happened in 1999, at the height of the dot-com bubble, when ERP slipped to just 2.0%, compared with its 50-year average of 4.1%. That was a good sign to reduce your portfolio’s risk exposure, because investors were not being adequately compensated for the risk taken.
This isn’t one of those times. If buying shares at 22x sounds expensive, the implied P/E ratio for a 10-year U.S. Treasury yielding 1.6% is 63x. The equity risk premium currently stands at 6.2%, as high as it was in the gloomy 1970s, when “stagflation” stalked the land. Far from gorging on risk, investors in today’s market are willing to leave an awful lot of potential returns on the table, just to avoid it.
Investors want—and perhaps need—some certainty in their financial lives. For most, shielding some part of their portfolio from a potential downturn with bonds and other uncorrelated assets makes sense. But it also makes sense, to the extent they can, to weather the often stomach-churning ups and downs of the market if it means earning a substantially higher return over time. Taking equity risk, when others don’t want to, is the way to get equity returns—in this case, as much as four or fives times the risk-free rate, compounded annually.
But why focus on eventual returns and ignore the prospect of immediate loss? If you think we may be nearing the end of the cycle, why not sell now, near the peak, and then buy back in later, at the bottom? The answer is quite simple: because getting it wrong—even a little wrong—can be very costly. Take this January, when many were convinced the end of the cycle was upon us. Someone who got out of the market before the short-lived sell-off missed a year-to-date +7.8% total return from the S&P 500. Someone who got scared and exited at the bottom of the sell-off missed an +18.5% rebound, plus dividends.
Since the start of 1979, the average annual total return (including dividends) on the Russell 3000 was 9.92%. An investor who missed the 10 best trading days over that 38-year period only earned 7.85% per annum, equivalent to losing all dividends. One who missed the 90 best trading days earned a negative (−0.35%) annual return. When did these key trading days happen? 48 of the top 90, and 8 of the top 10 days took place during or immediately after the 2008 crisis. One more of the top 10 took place immediately after the 1987 crash. An investor, chasing after market sentiment, who happened to miss these up days lost much of the return.
We don’t pretend to be able to call the exact top or bottom of any market cycle. It’s important to stay informed and aware of the risks and opportunities, but timing the market is a game for either geniuses or fools, and since we know we’re not geniuses, we’d rather not be fools. Rather than trying to guess the cycle, we believe in working with clients to develop, and stick with, a long-term asset allocation strategy that looks through the end of the cycle towards to a 2-4 year time horizon.
At some point—perhaps in early 2017, as sketched out in the 1Q16 strategy note, or perhaps later—this cycle will inevitably come to an end. When it does, the stock market will likely suffer a sharp downturn, and the typical investor will want to kick themselves (or their investment advisor) for not getting “out of the market” earlier. But as we’ve tried to explain, this isn’t the right way to look at it. A wiser investor will ask two questions: have I made adequate provision to ride out this inevitable but unpredictable setback, and can I expect to be adequately compensated for doing so? If the answers are yes, they’ll come out winners in the end.
To The Patient Belong The Spoils
Turning our eyes to the markets themselves for a moment, we come upon a scene of remarkable placidity. Aside from mild and momentary jitters in early September, most equity and fixed income markets around the world have hardly budged for the past two months. The U.S. dollar has been stable, on a trade-weighted basis, and oil has stayed within a $40-50 trading range. A whole series of real and potential dramas—a tighter-than-expected U.S. presidential race, ongoing uncertainty over Brexit, worries over the health of Deutsche Bank—have, for the most part, left markets curiously unmoved.
The U.S. economy putters along. Both the Atlanta Fed and the New York Fed now project U.S. GDP growth for Q3 at +2.2%. That’s substantially less than the strong rebound once hoped for, after a somewhat disappointing first half, but enough to keep hopes for better days alive.
Most of the economic data indicates a weak August, followed by a much stronger September. The ISM Manufacturing Index resumed its prior recovery path at 51.5, and indicated a solid flow of new orders, suggesting its one-month August contraction was a blip, not a trend. The ISM Non-Manufacturing Index, which covers a much larger segment of the economy, powered back from a worrying 51.4 to 57.1, bolstered, again, by new orders at a very strong 60.0. Industrial production declined −0.4% in August, down −1.1% from a year ago, but orders for core capital goods picked up +0.7% in July and +0.8% in August, following a deep and lengthy slump, perhaps indicating a much-needed rebound in business investment.
Consumer spending in August was flat, and retail sales lost some ground (−0.1%), although excluding autos and fuel, sales are still up +3.4% from a year ago. Auto sales rebounded to a healthy rate of 17.8 million/year in September, after an August dip. Perhaps most remarkably, the Conference Board’s gauge of consumer confidence surged to 104.1 in September, its highest point of the business cycle so far, in large part on the perceived strength of the job market. New jobless claims keep moving lower and lower, and the U.S. added a steady 156,000 jobs in September—a bit below expectations, but enough to neither encourage nor alarm anyone.
Emerging markets have been the big outperformers this year, with the MSCI EM Index up +16.3% so far, compared to +4.4% for the world as a whole. Some of these stories (Brazil, Argentina, India) we have confidence in, towards others (China, Russia) we remain quite wary. It’s worth noting, when we turn to more developed markets, that the −13.6% drop in Japan’s Nikkei has been more than cancelled, in real terms, by a stronger Yen, just as the +10.5% rise in Britain’s FTSE 100 has been more than cancelled by a weaker Pound.
The new worry on the international scene is Germany’s Deutsche Bank, which faces a $14 billion fine from U.S. authorities which could force it to severely dilute its shareholders in order to raise capital, unless the German government bails it out, or the U.S. backs down. On the surface, it’s essentially a political stand-off, but it takes place against the backdrop of weak European banks, dependent on ECB intervention to prop up the value of the assets keeping them solvent. Now the ECB’s imposition of negative interest, meant to spur lending, has turned the cash balances created by that very intervention into a drain on bank’s resources. We expect that, as usual for Europe, an actual meltdown will be averted, but the underlying problems will continue to fester and undermine confidence in the region’s growth prospects.
The U.S. presidential race remains the Greatest Show on Earth, and not in a good way. The odds still favor a Clinton victory. Despite Trump’s surge in the polls in early September, he hasn’t held an actual lead since just after his convention, and the electoral map is stacked against him. We keep hearing quiet murmurs that Republican leaders in Congress are hopeful about striking pragmatic deals with a Clinton Administration on the budget, tax reform, and maybe even trade and immigration—a big change from years of gridlock, should it happen. With the PCE measure of inflation running at just +1.0%, the Fed is under little pressure to raise rates, but a shift towards a more proactive fiscal policy—whatever its other benefits—could change that.
None of this offers any clear direction for markets. Our advice, which we’ll repeat from the start of this letter, is to have realistic expectations and keep your eyes on the long term. To the patient belong the spoils.
This communication contains the personal opinions, as of the date set forth herein, about the securities, investments and/or economic subjects discussed by Mr. Chovanec. No part of Mr. Chovanec’s compensation was, is or will be related to any specific views contained in these materials. This communication is intended for information purposes only and does not recommend or solicit the purchase or sale of specific securities or investment services. Readers should not infer or assume that any securities, sectors or markets described were or will be profitable or are appropriate to meet the objectives, situation or needs of a particular individual or family, as the implementation of any financial strategy should only be made after consultation with your attorney, tax advisor and investment advisor. All material presented is compiled from sources believed to be reliable, but accuracy or completeness cannot be guaranteed. © Silvercrest Asset Management Group LLC

