Welcome to 2025, a compilation of the 1970s, 1980s, and 1990s. It has all the greatest hits.
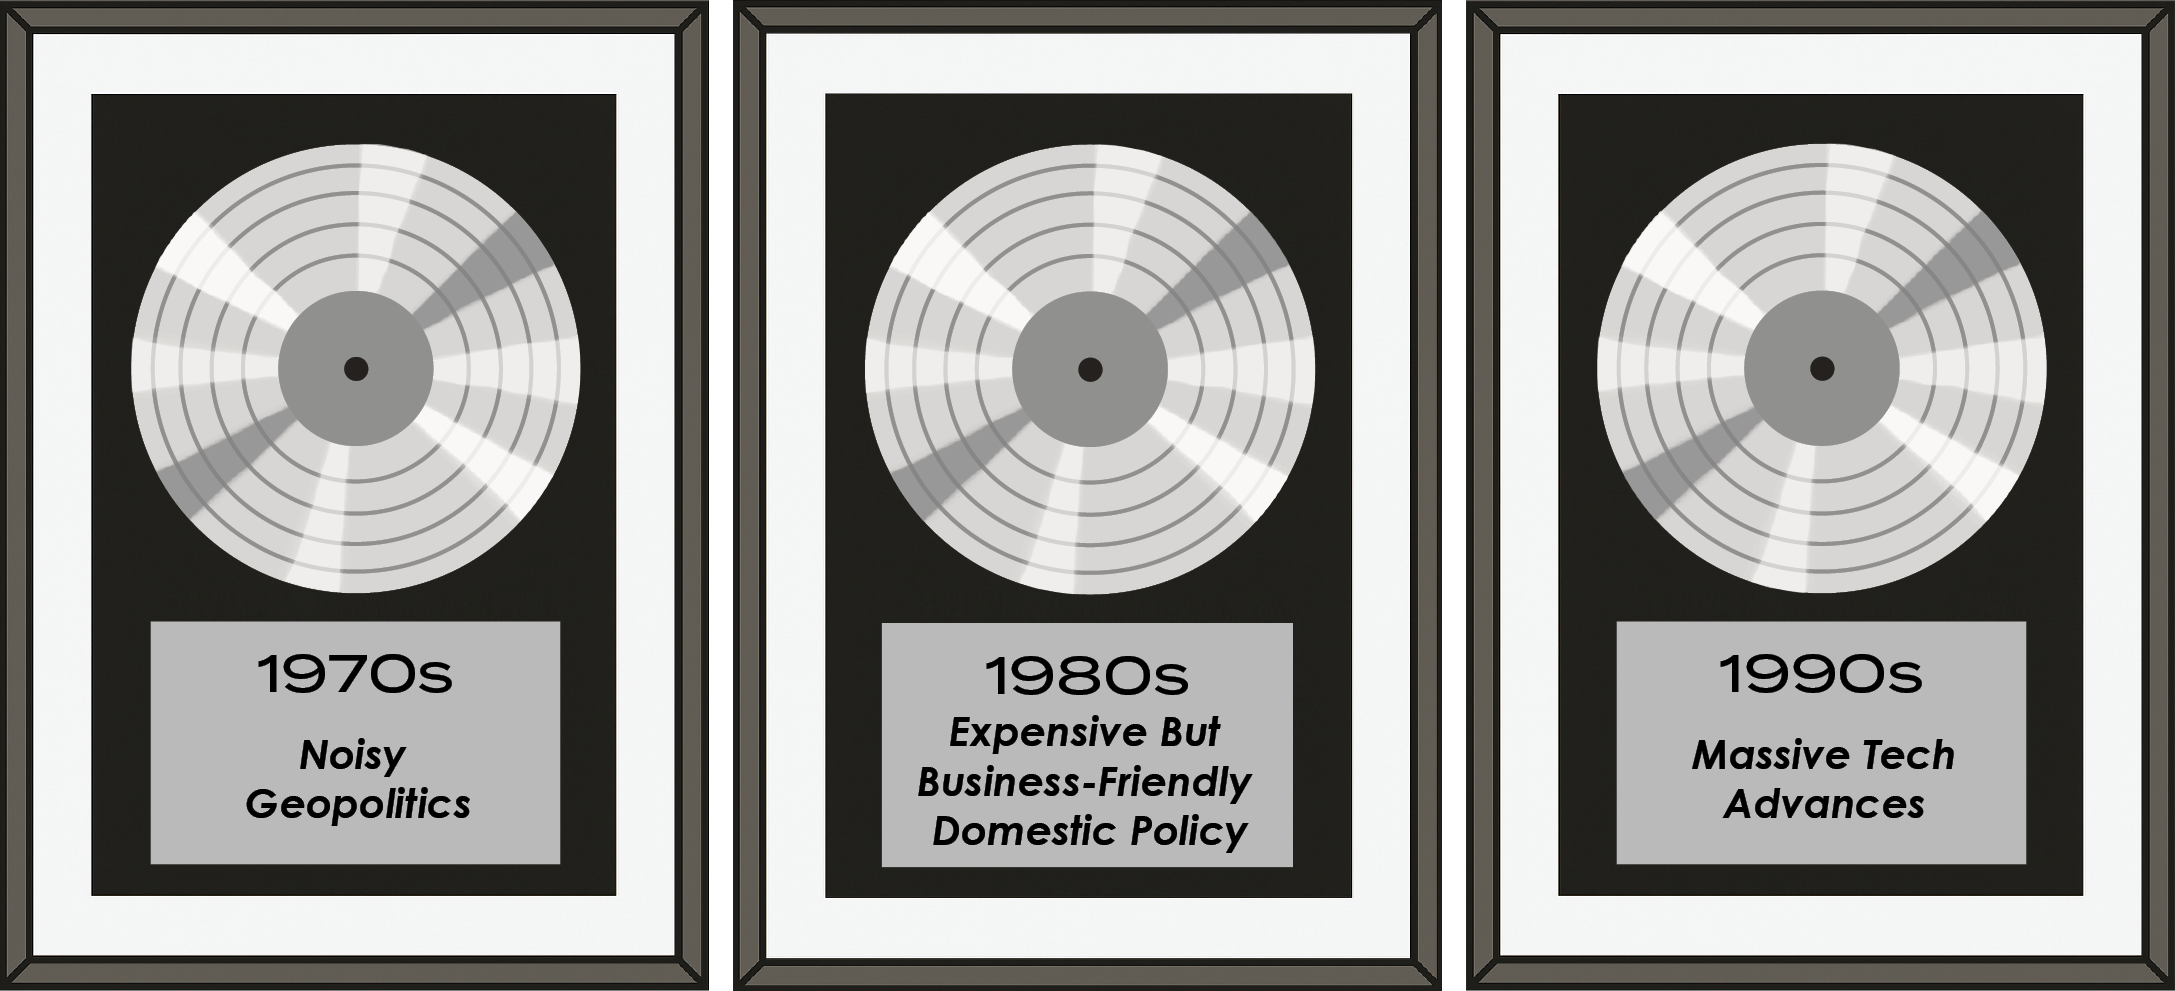
Geopolitics—Turbulent but much more stable than the 1970s
Our valuation model for equities encompasses factors across fundamental metrics, such as interest rates, sentiment, and geopolitical and domestic policy.
Today’s geopolitical challenges are substantial: military conflicts in the Middle East and Europe, trade tensions with China, and a politically divided electorate. Yet they don’t rise to the level of turbulence seen in the 1970s. With the war in Vietnam, the hostage situation in Iran, the large-scale Cold War with the Soviets, a closed-off China, and the Bretton Woods agreement, the geopolitical uncertainty of the 1970s was unmatched. While the world is ever-evolving, and the current geopolitical backdrop is tense, we deem it slightly worse than average over the long haul but not comparable to the massive problems of the 1970s.
In recent history, recall predictions of Europeans needing to burn furniture for fuel after the Russian invasion of Ukraine, or more recent projections of $130 oil in the immediate aftermath of the U.S. bombing of Iran. The coming days will likely remain tense, and many of the world’s challenges lack simple solutions. There are three paths forward. The worst is an ongoing and unpredictable escalation of global conflicts. In that scenario, there would be a hit to valuation metrics. The best case would see a gradual easing of tension and peaceful realignment of interests. In this scenario, valuations could improve. Our base case is continued days and weeks of uncertainty, but with minimal expansion of conflict. In this scenario, valuations would remain in a holding pattern.
Warfare tactics are evolving rapidly. Recent examples of drone usage to significant effect and the singular power of American GBU-57 delivered via B-2 bomber illustrate both the small-scale and massive-scale options for disrupting an enemy. These developments also represent changes in the defense industry and highlight the continued need for innovation.
While the present is not tranquil, today’s challenges have been mostly stable and contained over the past few years. To date, there is little sign of significant disruption to incomes, spending, or earnings from this turbulent backdrop. While tariff effects will eventually drag on growth, companies will adjust to preserve margins.
Given the Trump administration’s clear focus on domestic economic growth, we expect that pattern to continue. On our scale of –10 to +10, we deem the geopolitical backdrop to be at –3.
Domestic Policy—Costly, but additive to growth, like the 1980s
On the domestic front, the policy implications of the One Big Beautiful Bill Act align with the “run it hot” philosophy we anticipated from the administration.
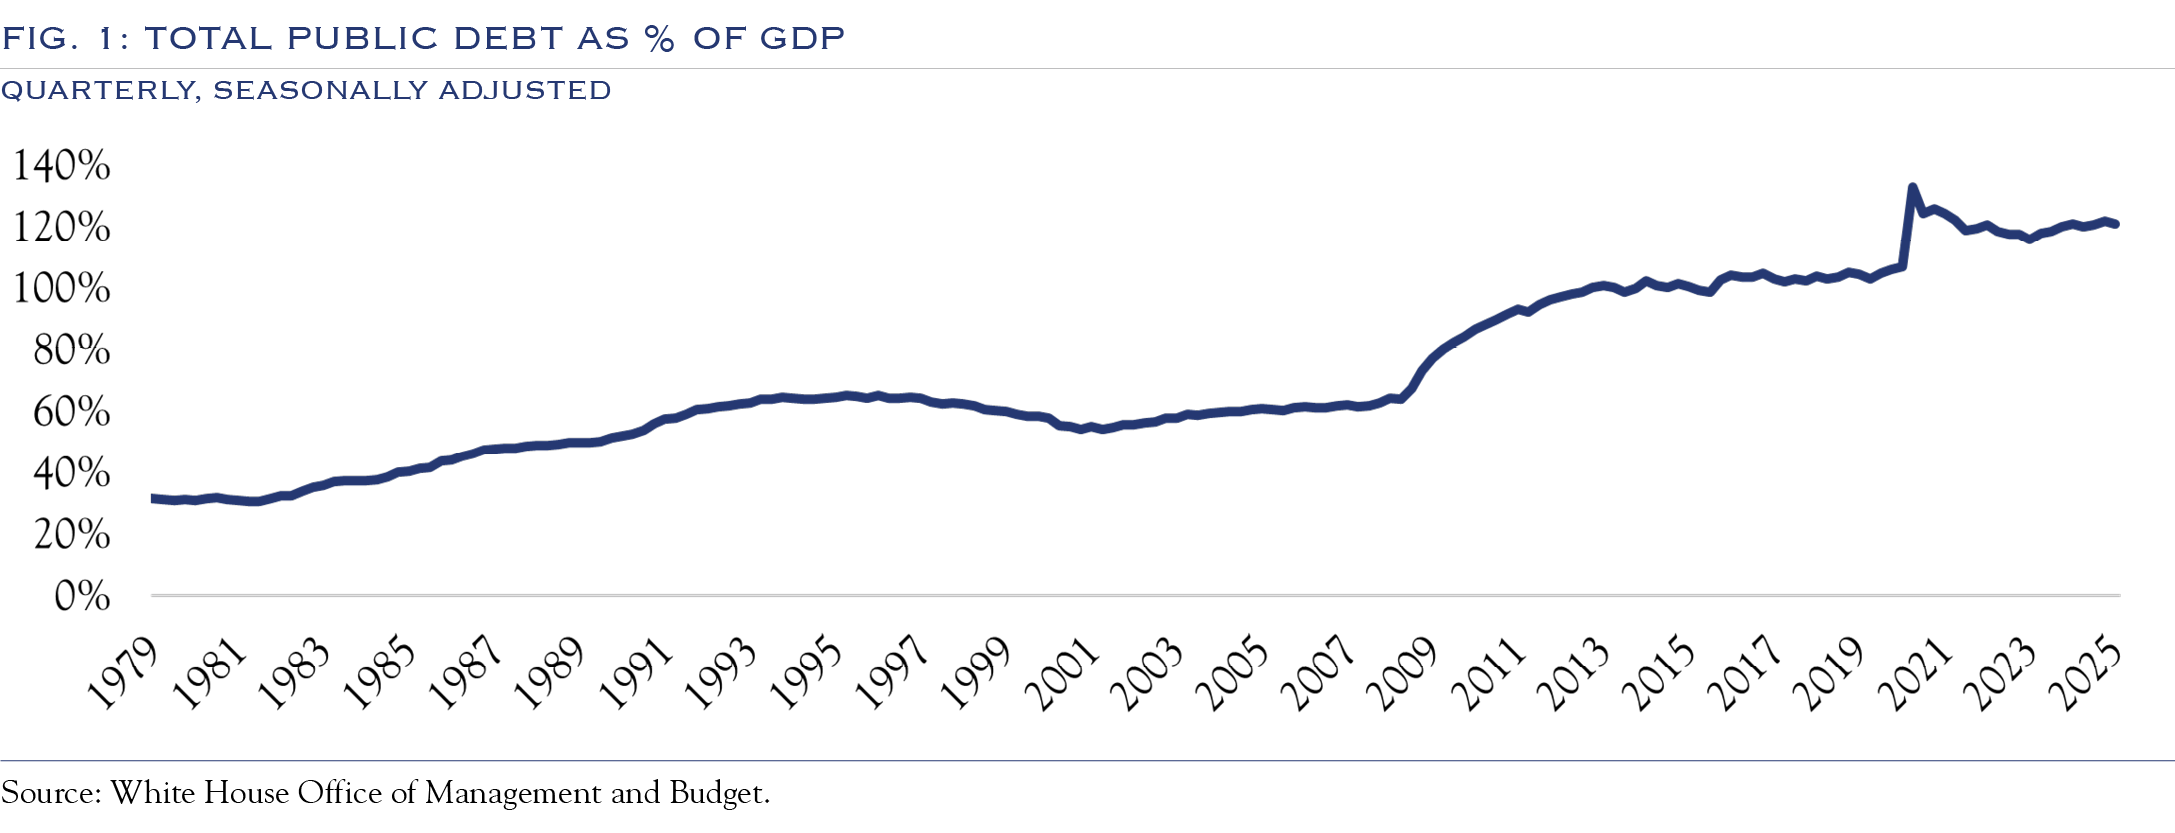
The deficit and debt situation should remain manageable, as it has in other major economies.
First, the bad news. As in the 1980s, the deficit and debt are rising. The U.S. will run a deficit of around 7.0%. This will add to the total federal debt, currently sitting at about 121% of GDP as shown in Figure 1. The deficit and debt have been intractable problems and require compromise—or, more likely, crisis—to force a resolution. In the meantime, growth is the best path forward to help keep debt levels stable relative to the size of GDP. With a significant debt burden, interest rates play an important role. Over time, as inflation and Fed policy rates decline to lower levels, the cost of interest payments will follow suit. Another influence is the revenue derived from tariffs. While the policy and its effects are still evolving, tariff revenue will help reduce the deficit. If a debt crisis were to emerge, it would almost certainly force a bipartisan modification of entitlement programs. For now, the deficit and debt situation should remain manageable, as it has in other major economies.
Economically speaking, the better similarity with the 1980s is the effort to ease regulatory burdens and enact policies encouraging growth. The most substantive will likely be the accelerated depreciation provisions designed to spur domestic capital expenditures. Together with the ongoing trends of “reshoring” and investments in AI and robotics, we believe the provisions will be additive to U.S. economic growth.
Tech Innovation—An improved and muted version of the 1990s
Perhaps the most favorable comparison to prior eras is today’s rate of technological change. Developments in AI and robotics have the potential to produce significant and widespread gains in productivity and provide fuel for continued expansion of profit margins. Further, this progress has come with only a modest dose of the valuation enthusiasm and speculation that accompanied the internet bubble. For example, in 2000, the internet era’s poster child had a peak PE ratio of 208x. Today’s poster child for AI currently has a PE of 48x, with a peak reading of 84x in 2021. This four-year decrease in PE ratio demonstrates strong earnings power and clarifies that while stocks aren’t cheap today, they are far from the speculative levels of the late 1990s.
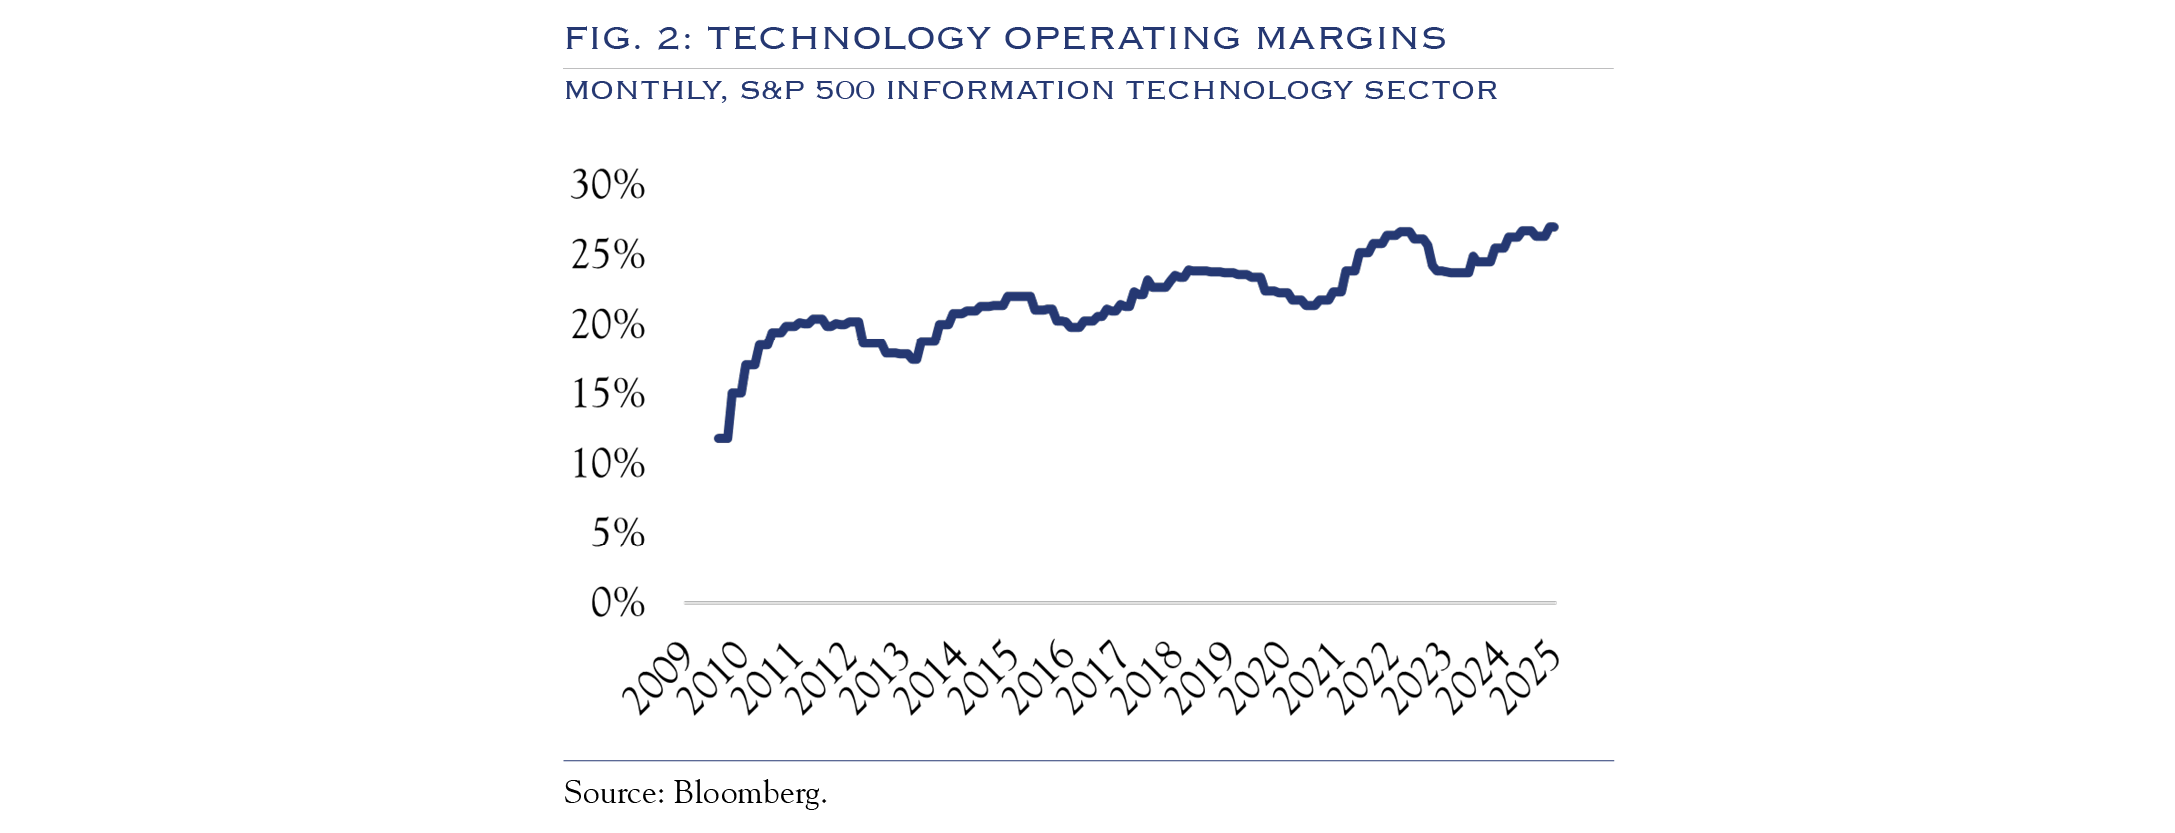
With AI, the anecdotes are everywhere, pointing to legitimate progress in building efficiencies. It is showing up in the numbers as well. Consider Figure 2. As noted by research firm Trivariate in a recent piece in Barrons, “profit margins will likely be a crucial differentiating factor in stock performance in the second half of the year”.(1)
In December 2024, we built a model showing the potential margin gain from implementation of AI. This included conservative estimates and didn’t consider other technologies, such as robotics. More recently, Morgan Stanley conducted a similar, detailed analysis in Counterpoint Global Insights’ “AI Beneficiaries: Investing in Second-Order Effects.” This work shows similar findings to those in our analysis, “The Three Waves of AI Adoption & the Impact of Technological Innovation on Productivity.”
But it isn’t just the big players that are benefiting. As implementation costs come down, smaller firms are also starting to get into the mix. A confluence of developments in technology is driving innovation. The Wall Street Journal reports that Amazon’s use of robots has led to the lowest number of employees per facility in the past 16 years.(2) As the cost continues to decline for implementing solutions in robotics and AI, the productivity should spread to smaller firms.
Across all segments, large/small, growth/value, it sets up a very Darwinian environment. Companies that execute transformation based on the efficiencies afforded by new technologies will see higher profit margins and solid stock performance, while those who don’t adapt will lag.
U.S. Economy
While tariffs and the uncertainty around trade policy may ultimately exert downward pressure on economic growth, they have not yet presented any significant economic problem. The two most prominent models of economic growth, GDPNow and WEI, estimate growth rates of +2.85% and +2.37%, respectively.
Consumption data and the downward revisions in GDP indicate a slowing of spending. It is unclear whether this is: 1) one-off as a result of uncertainty, 2) temporary as a result of tariffs shifting spending patterns, or 3) a fundamental change in trend for the economy. For now, it appears to be a combination of 1 and 2. Future payroll figures, weekly jobless claims and metrics like hires and wages will be important. Further, we are paying especially close attention to real-time economic data.
The New York Fed recently published a survey of manufacturing and service firms in the New York region, inquiring about their plans regarding pricing strategy under the new tariff policies. Across all respondents, 75% planned to pass along some of the tariff hit to customers via price increases. The average rate of pass-through was 55%. This means that, in addition to substitution effects, the mechanical calculation of tariffs will be reduced by another 45% (the portion not passed on to consumers). Unless tariffs are increased further from current levels, the inflationary effect should be modest and tolerable.
Given the timeline of inflation reports, it is still a little too soon to know if our thesis is correct. However, the situation should be clarified by mid-July with the release of the June inflation data. As of the April 2 tariff announcement, research from Deutsche Bank estimated inventory levels and additional purchases acquired through advance purchases. The analysis concluded that firms would have the means to operate from inventories (without addressing tariffs) perhaps through early June. Thus, the inflation situation in June should mostly capture the effects of tariffs. Recent analysis from Neel Kashkari of the Minneapolis Fed asks a similar question in a note titled “Tariff Impacts: Delayed or Avoided?” He concludes: “I see two likely explanations: The economic effects of the trade war are delayed, or companies are finding ways to avoid the tariffs (or some combination of both).”
In our view the tariff effects won’t remain entirely invisible, but they will be quite manageable.
In addition to the GDPNow and WEI models, real-time economic activity metrics have remained remarkably stable in recent months. For example, the Johnson Redbook Index, calculated weekly, reports a +4.5% year-over-year increase in retail sales as of June 21, 2025. This data set covers 9,000 stores in the United States.
Meanwhile, survey data mainly present a fairly dour sentiment from consumers. One reason seems to be that survey respondents report conditions worse than their actual experience. A research note from the Federal Reserve reports some peculiar findings. The research examined actual income and spending data, along with sentiment metrics. A few key points:
- Consumers were more likely to overestimate rather than underestimate inflation.
- Those who overestimated inflation reported feeling worse about economic conditions.
- While most respondents reported higher incomes, they still said they did not feel good about the economy.
- Overall, the results showed that what consumers have been saying differs from what they have been doing.
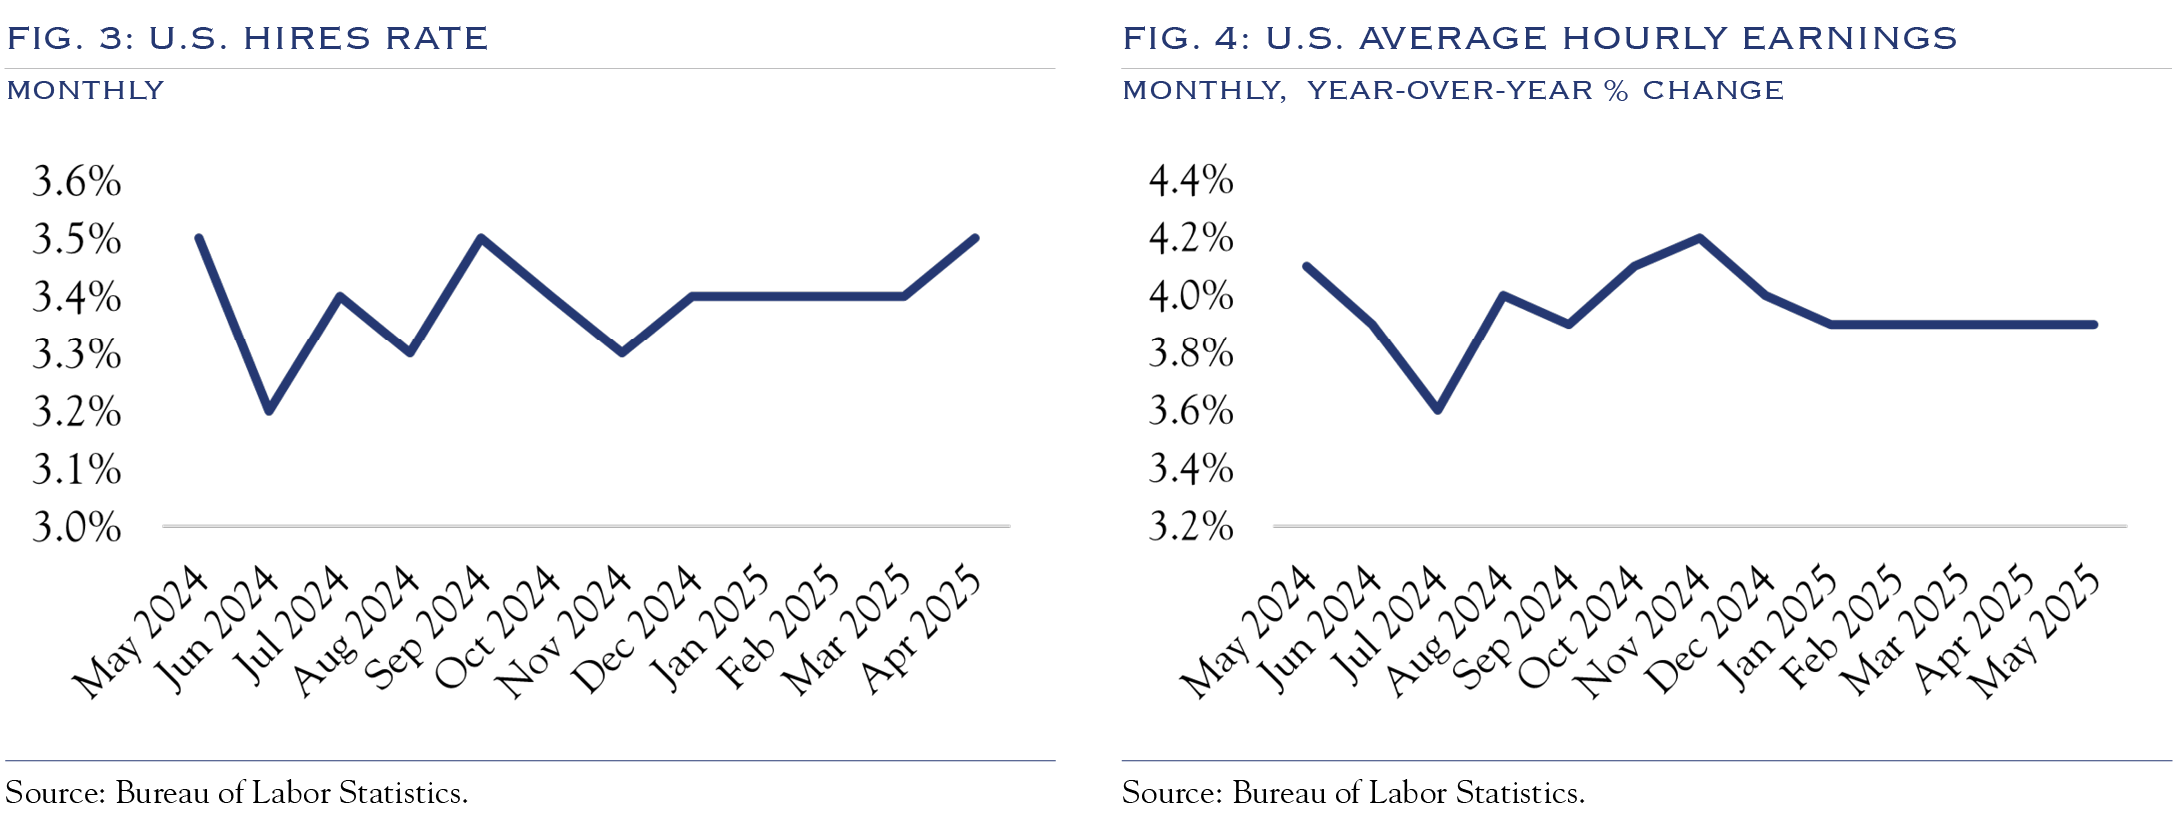
The most critical piece of scaffolding holding up spending is that payrolls and wages continue to expand. Our back-of-the-envelope “ability to spend” measure is increasing at a robust rate of 5.0%. This measure considers the expansion of payrolls as measured by the JOLTS Hires Rate and the expansion of wages via Average Hourly Earnings, measured year-over-year reduced by CPI. Both are shown above in Figures 3 and 4.
Fed/Rates
All interest rate analyses must acknowledge the influence of a Fed Funds rate set at 4.5% for a long stretch, which is unlikely to go below 4.0% until sometime in 2026. The Fed’s paused stance on rates has been primarily for good reasons, but it does keep the yield on the U.S. Ten-Year Note anchored in a range around the 4.5% Fed Funds target.
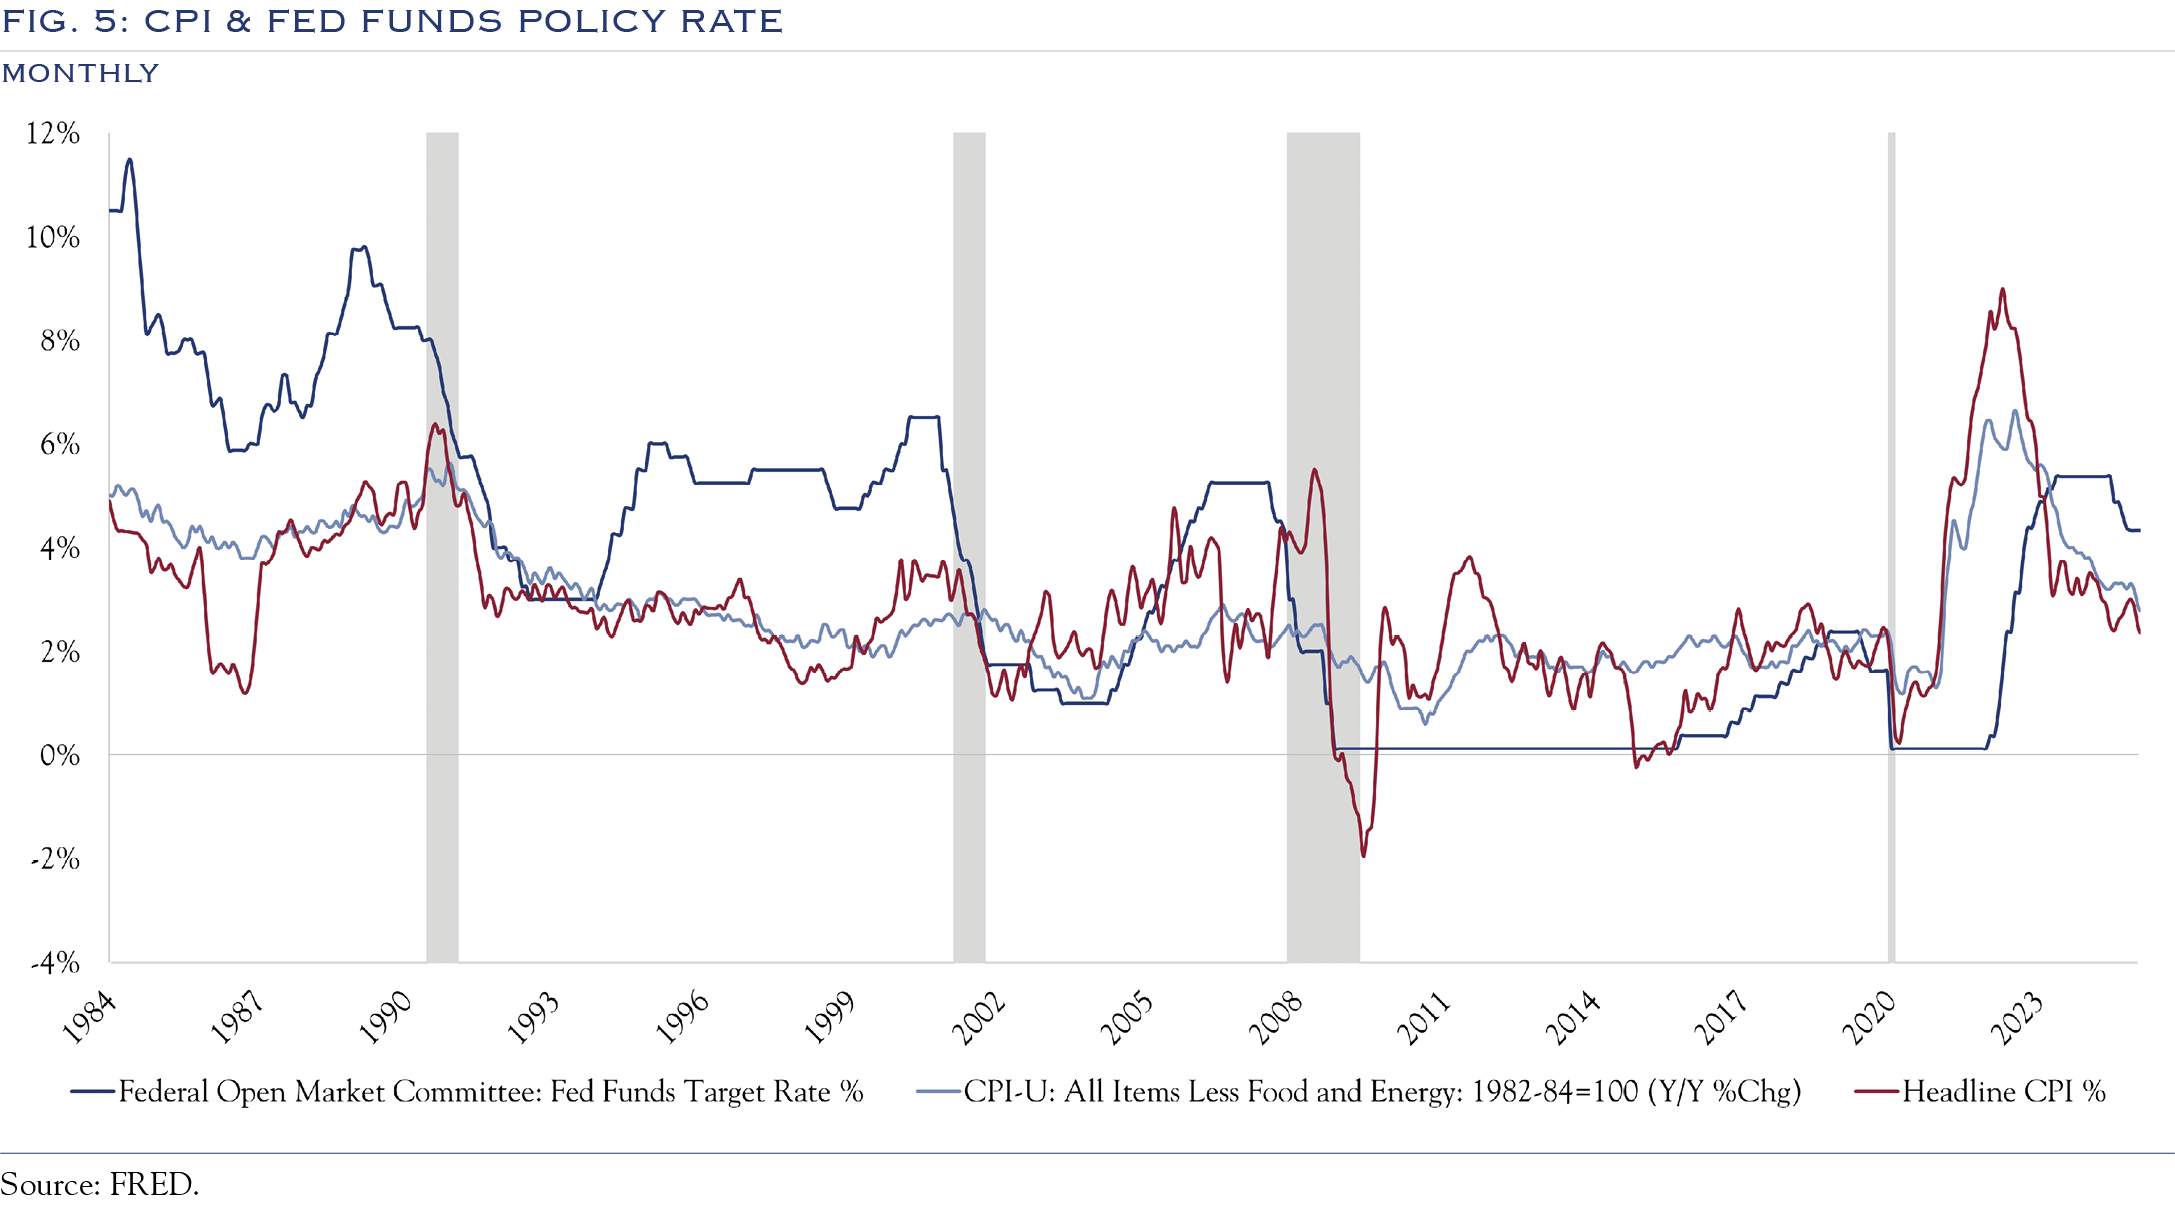
Timeline for rates to improve
Based on comments at the Federal Open Market Committee (FOMC) last week and ongoing economic and inflation conditions, we anticipate the Fed will remain on hold until at least the September meeting and with gradual “normalization” cuts to 3.5% sometime in the middle of 2026. As those cuts eventually get underway, bond yields will likely follow suit, eventually trading in a lower range.
Inflation has been inching lower, but some stickiness or even a slight uptick may be seen owing to the mechanical adjustment of tariffs, which have contributed to higher price levels.
While we project lower rates, the path to get there will be slow. For now, though, absent any surprise moves lower in rates, we think it is highly likely that equity valuations have hit an interim ceiling.
This leaves earnings as the primary source of fuel to power future gains.
Earnings Outlook 2Q & Beyond
FactSet reports 2Q expectations for S&P 500 earnings growth of +4.9%. We think the headline masks a great degree of dispersion. Results will diverge not only due to the direct effect of tariffs (which analysts can essentially model), but also from the response of management teams, which will vary widely. Beyond tariffs, ongoing trends in AI make it more important than ever to seek high-quality firms with management focused on executing change in a turbulent environment. This is where earnings gains will be found.
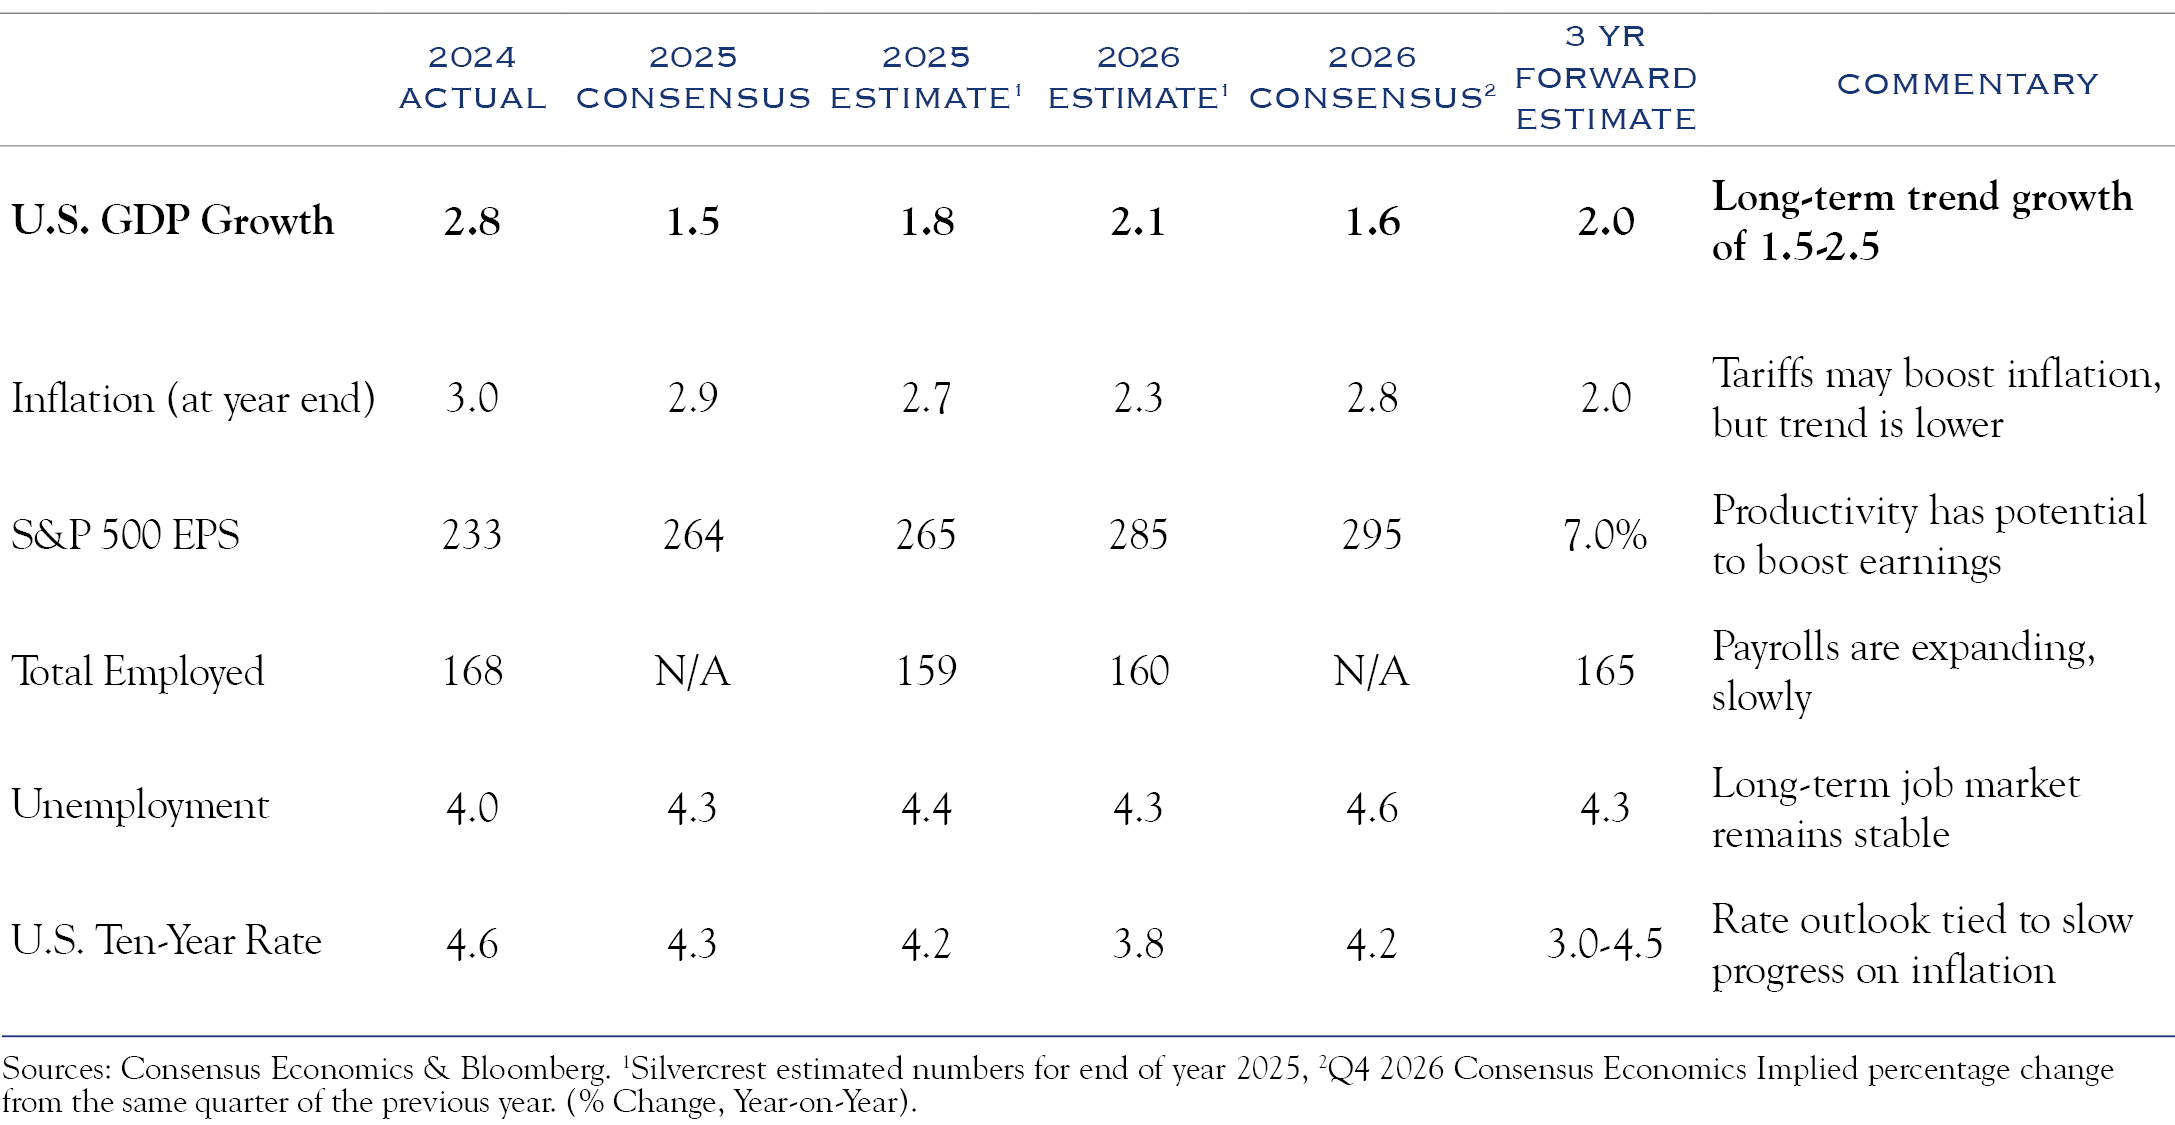
In the long term, we ground our three-year forward-looking earnings analysis in history and adjust to current circumstances based on real-time economic growth rates. Using data starting in 1948, corporate profits as measured for the entire U.S. economy have averaged 7.6%; over the past 50 years, they have averaged 7.7%. The comparable figure for the S&P 500, available over the past 50 years, shows earnings growth has averaged +8.5%. This makes intuitive sense, as the companies that rise to the top tend to be those that are the most profitable. To fine-tune these longer-term figures into current estimates, we evaluate the current state of the economy. Our historical analysis shows that GDP growth in the +1.5% to +2.5% range produces earnings gains in the high single digits. A recent analysis from Goldman Sachs draws a similar conclusion, stating that a 100-basis-point change in GDP creates a 3% to 4% change in S&P EPS.
With the USD down –10.70% YTD, it is essential to consider the role of currency, particularly for large-cap companies that obtain about 30% of their revenue from overseas. A weak dollar can boost earnings if a company imports revenue (as many large-cap companies do). If a company imports costs (say, raw materials for manufacturing), the weaker dollar is a headwind as those imports become more costly.
Uncertainty over U.S. policy contributed to the decline in the dollar, as did a desire by foreign investors to rebalance after several strong years of U.S. equity returns. While some countries will continue to attempt to diversify away from the dollar deliberately, the dominant structural advantages held by the dollar mean that this will be a slow process. Whether measured by percentage of transactions, availability of high-quality collateral or demographic growth estimates, the dollar is built on top of a powerful foundation.
While we see some upside to earnings from the dollar, this will be an episodic event. Given the turbulent macroeconomic backdrop in the second quarter, it is equally likely that disruptions in supply chains or paused decision-making will drag earnings. Longer-term, the margin improvement story is critical. We will be looking for any signs of weakening demand for the upcoming earnings season. We have not seen this in any meaningful way in the economic data and eagerly await the early reporting of large-cap banks and consumer-facing companies for a read on the economy.
Outlook
Despite the noisy domestic and global political backdrop, we expect some stabilization in the months ahead and the economy to weather the storm. Valuations are a limiting factor, but earnings will be the foundation for future returns. Patience will be rewarded. In just the past few months, markets have experienced two extremely significant disruptions, and potential reasons to cut risk (unexpected tariff news and the U.S. military involvement in Iran). That both were overcome quickly, with positive results following shortly thereafter, highlights two important concepts. First, the equity market shows resiliency and a willingness to look through disruptions. While part of the rationale is behavioral (buy the dip) and part is liquidity-driven, another important dynamic is at hand. The second, perhaps primary reason markets rally through the noise is a growing recognition that companies can create their destiny via productivity gains feeding into margin expansion. This is an important theme we see evolving in the years ahead.
Asset Allocation
Equities
While our valuation model shows equities to be slightly overvalued in the near term, an eventual easing of rates will allow valuations to remain steady, while earnings gains power future returns.
Growth/Value
We retain our equal weight posture. Given the powerful wave of technological change, company-specific factors will be more determinative of results than “growth” or “value” designations. As an example of the index movement corrupting these style metrics, note that Amazon will partially enter the “value” category in Russell’s June 2025 rebalancing.
Large/Small
While small-cap exposure has been a detriment for some time, we see five primary catalysts for gains in small caps in the years ahead.
- Interest rates will eventually move lower. In addition, easing of bank regulations could free further capital to help fund smaller company balance sheets. Both developments will help small caps, which tend to have higher financing needs.
- With midterm elections on the horizon for 2026, policy change should stabilize. This will allow for a more forward-looking posture concerning M&A, which historically has been a driver of returns for smaller companies.
- The deliberate policy focus on domestic activity, manufacturing, reshoring, etc., will accrue partly to benefit the more domestically focused small-cap universe.
- As the implementation cost of AI and robotics continues to decline, broader usage will enable margin gains for smaller and larger companies.
- Anecdotally, we observe more and more allocators open to starting to dabble in small caps.
While large continues to lead the way, the gap is smaller than in recent years, making for a lower opportunity cost. We expect continued success from large-cap equities and anticipate those gains spreading to small caps later this year and into next year’s election.
Non-U.S.
While select valuation-led opportunities exist and allocators seem eager to rebalance back towards non-U.S. exposure, we continue to maintain only modest exposure for U.S.-focused clients. We note that most of the outperformance of non-U.S. equities occurred in the first quarter, with more even results in the second quarter.

Rates
While the process will be slow, we look for declining rates and are comfortable maintaining interest rate sensitivity close to benchmark levels.
Credit
While the economy is solid, many credits are priced for perfection, with tight spreads. Thus, we advocate for careful security selection in the credit arena.
Overall, turbulence should settle down as the year progresses. While growth has slowed, the economy continues to expand. A more settled environment and coming legislative changes will favor economic growth.
(1) “4 Ways to Find Winners in a Rising Market” by Teresa Rivas.
(2) Amazon Is on the Cusp of Using More Robots Than Humans in Its Warehouses” by Sebastia Herrara.
This communication contains the personal opinions, as of the date set forth herein, about the securities, investments and/or economic subjects discussed by Mr. Teeter. No part of Mr. Teeter’s compensation was, is or will be related to any specific views contained in these materials. This communication is intended for information purposes only and does not recommend or solicit the purchase or sale of specific securities or investment services. Readers should not infer or assume that any securities, sectors or markets described were or will be profitable or are appropriate to meet the objectives, situation or needs of a particular individual or family, as the implementation of any financial strategy should only be made after consultation with your attorney, tax advisor and investment advisor. All material presented is compiled from sources believed to be reliable, but accuracy or completeness cannot be guaranteed.
© Silvercrest Asset Management Group LLC