
Regardless of your view of the many U.S. presidential inaugurations that have taken place since 1789, we hope you have a favorable view of this inaugural issue of Silvercrest’s Economic & Market Insights.
We aim to provide two publications per year, discussing issues that are timely and relevant for investors. The Silvercrest professionals sharing insights on these topics bring a depth of experience and a variety of expertise.

Robert R. Teeter
Managing Director, Chief Investment Strategist30 Years
Average experience of Investment Policy & Strategy Group
25 Years
Average experience of managers of Silvercrest proprietary investment capabilities
30 Years
Average experience of Silvercrest Portfolio Managers
Post-Election Equity Rally
Municipal Bond Update
Our Equity and Fixed Income Portfolio Managers, Roger Vogel and Patrick Bittner, will share insights from their respective strategies.
A Conversation on the U.S. Dollar
Sorting through the impact and feedback of strength or weakness in the U.S. dollar is not a simple exercise. Strategist Patrick Chovanec provides some color on how investors should be thinking about the U.S. dollar.
Economic & Market Overview
We will also provide some context on the current economic and market environment through a short collection of charts. Hopefully each will provide at least 1,000 words of value.
Budget Reconciliation
Over the next few months, we expect to hear a lot about the nuanced and important budget reconciliation process taking place in Washington, D.C. Patrick Chovanec provides a detailed picture of this process and what we might expect.
What to Make of Hedge Funds
Anyone reading a newspaper has heard the multitudinous criticisms of hedge funds. With apologies to Shakespeare and others, hedge funds are not good or bad. But what are they? In our view, it’s best to define an objective before reaching for a tool. As Martin Loeser explains “The primary reason we invest in hedge funds is to get exposure to strategies, risk premia and asset classes that are not easily accessible via other mechanisms.”
Investment Outlook Summary
Finally, tying it all together, the Silvercrest Investment Policy & Strategy Group provides insight on asset allocation from our most recent quarterly review.
Economic & Market Overview
GDP Contributions
Quarterly
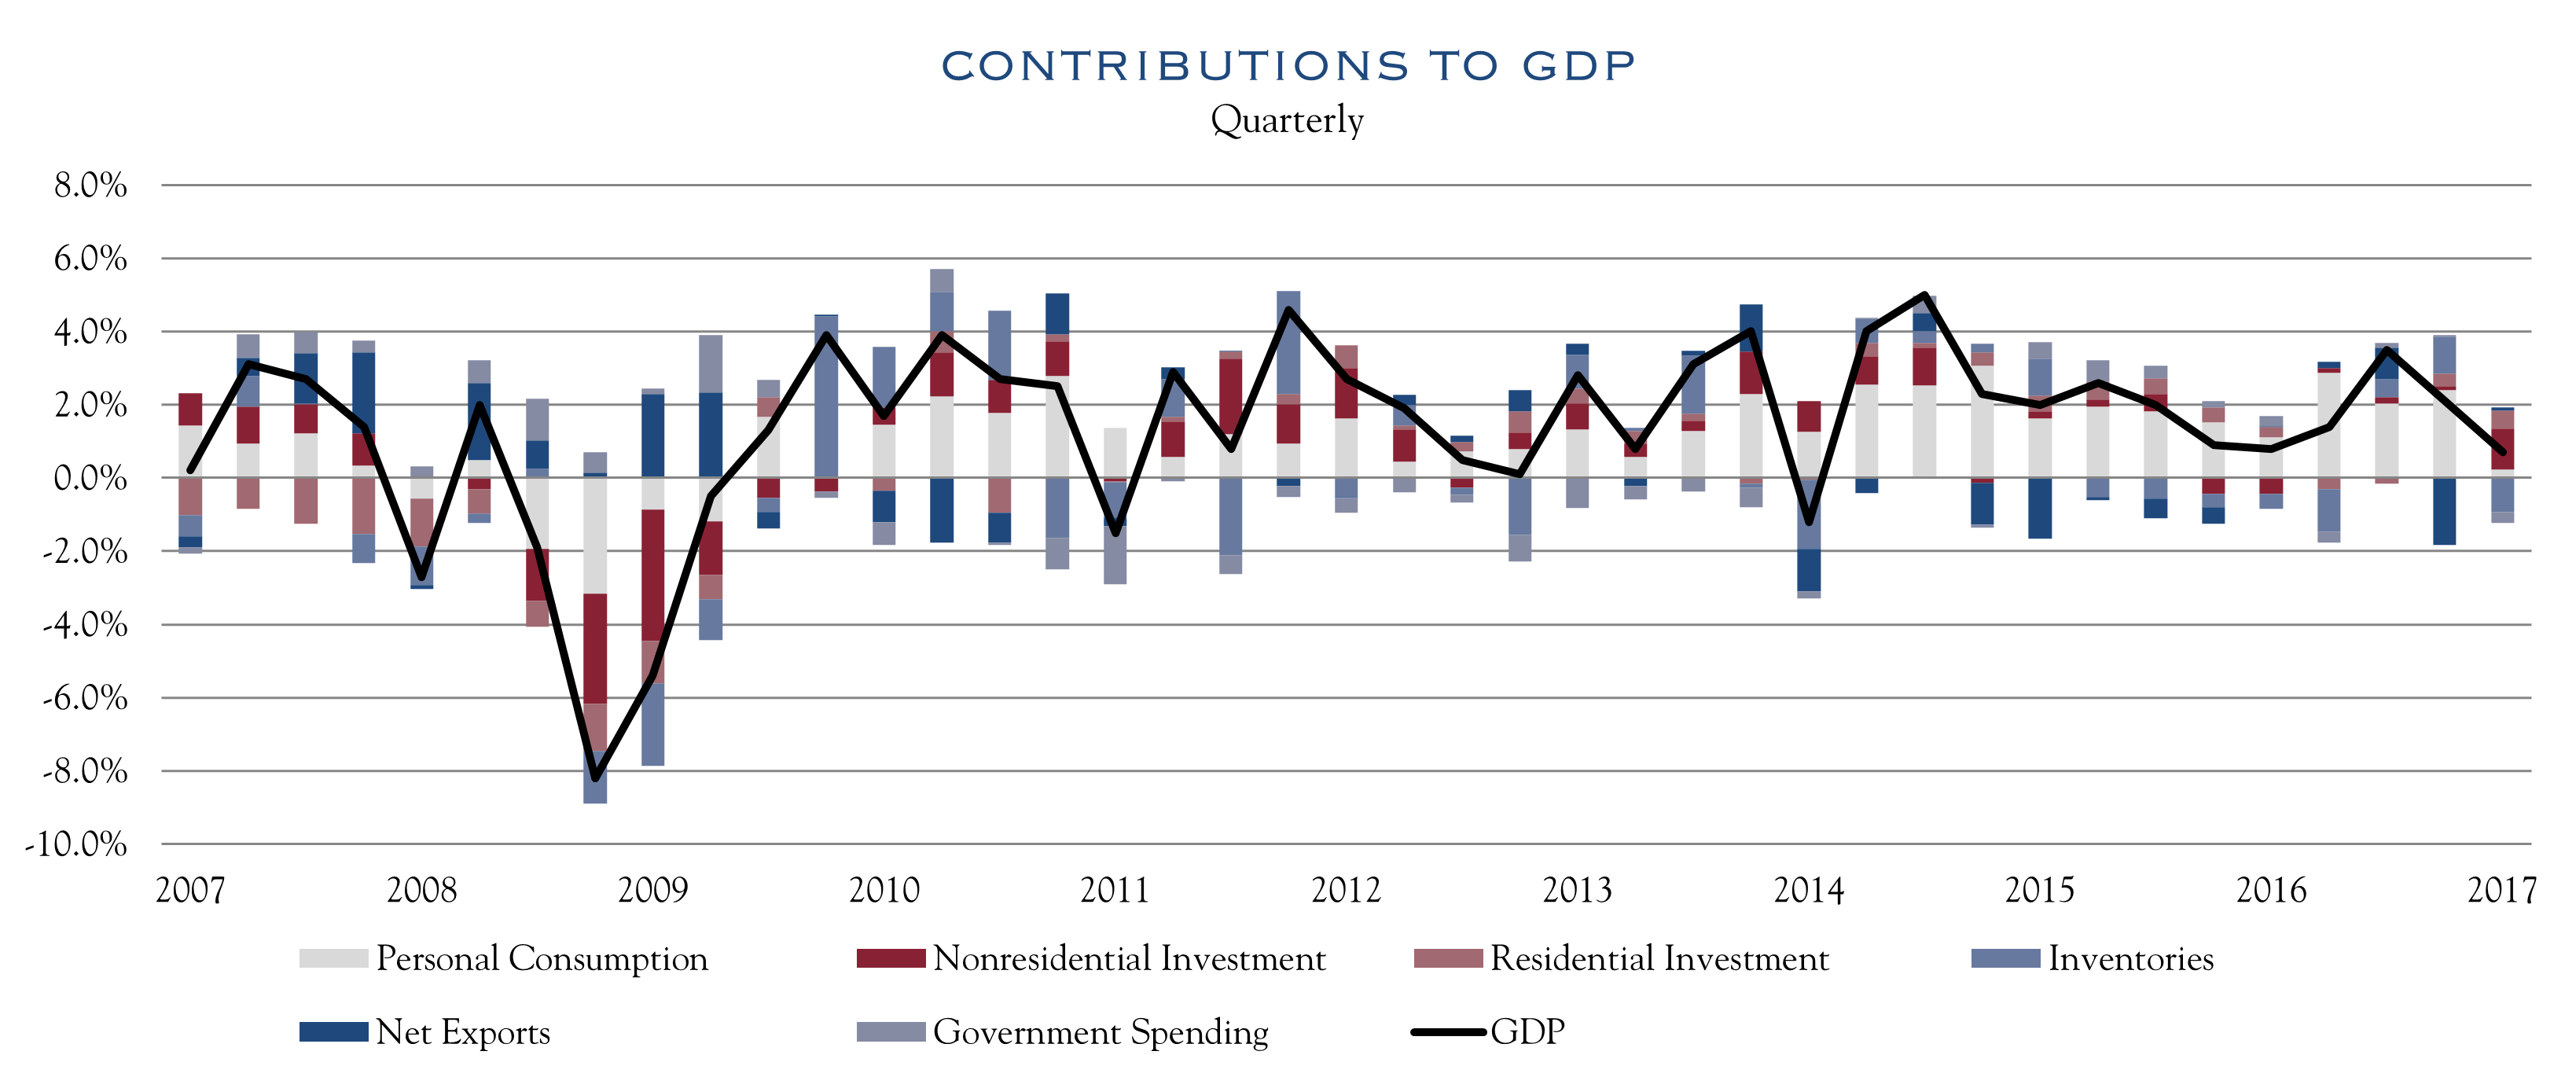
Source: BEA, as of March 31, 2017
While GDP growth has moderated following the significant decline and recovery during the financial crisis, it continues to oscillate, frustrating all efforts to produce consistent and higher growth.
Starting at a growth rate near 2.0% in late 2007 at the outset of the crisis, GDP growth turned negative for several quarters before starting a largely positive and long-lived, yet range-bound journey through the first part of 2017.
The major components of GDP, as well as economic sectors have often been out of sync, preventing growth from becoming too hot or too cold.
In the chart above, we show major contributors/detractors to GDP.
This illustrates that while overall GDP growth rates have generally remained in a tight positive range, the contributors have continued to change in both direction and magnitude.
This long, slow recovery has provided a supportive backdrop for appreciation in equities.
U.S. Employment
Millions employed, 16 years and older
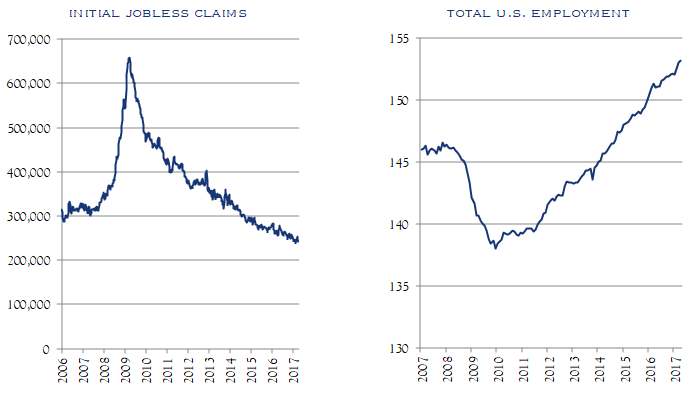
Source: Bureau of Labor Statistics, as of April 2017
The long, slow recovery in GDP has supported not only equity values but a recovery in employment as well.
Significantly, both the unemployment rate and the number employed have recovered to pre-crisis levels. In the absence of strong wage growth or consumer re-leveraging, consistent expansion in payrolls has been a key driver of consumption growth in this recovery. As the U.S. economy approaches full employment, wage gains—supported by productivity gains—will have to play a larger role in sustaining growth.
Price/Earnings
In the first part of 2017, as markets continued to advance, we have heard comparisons to 2000. To investigate, we decided to take a trip back in time using historical data. Dated data can be somewhat spotty and suspect, but we are able to get enough of a look for some basic comparisons on valuation between March 2000 and May 2017.
The first step was to determine the current and prior drivers of return in the S&P 500 as measured by attribution. We identified the top 20 contributors to the S&P 500 returns. These are displayed in the table below, ranked by their attribution impact, calculated as allocation in the index multiplied by return.
Top 20 Attribution Within S&P 500 Valuation Statistics
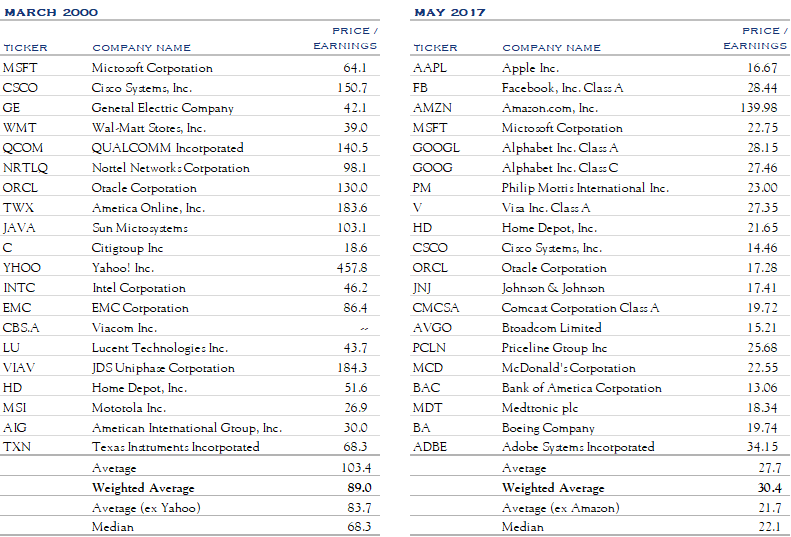
Source: Factset, as of May 5, 2017
In March 2000, weighted average P/E (Price/Earnings) of the top 20 companies was 89.0. In May 2017, the weighted average P/E of the top 20 companies was 30.4. Similarly, excluding the highest P/E stocks (Yahoo and Amazon), or just taking median or a simple average, shows that the key drivers of return in 2000 were significantly more expensive than in 2017.
It is especially challenging to conduct a deep dive into data integrity and the many assumptions that are made in collecting historical data. However, there is enough signal in the noise to highlight the meaningful valuation disparity between today and 2000.
While there may be other reasons to compare today to 2000, valuation of the key contributors to the S&P is not one of them. ETF’s may be responsible for a lot of flows to the S&P, but they are not yet driving 2000-style valuation.
A normal decline can occur at any time. It would certainly be very normal for a 10% correction to occur. However, a more serious bear market would likely require fuel from things like a recession, inflation or excesses, such as those seen in valuation in 2000 or credit markets in 2007.
We will continue our quest to identify any meaningful excesses that may sow the seeds of a serious decline. In the meantime, it is wise to prepare for a normal decline with proper allocation and reasonable expectations.
As with most trips down memory lane, there are numerous interesting observations in these tables. Surely 20 years from now, today’s top 20 will look different as well.
Relativity in Markets
As can be seen in the table (below), in 1987, the earnings yield (inverse of P/E ratio) on the S&P 500 was less than half the yield of the Barclays Aggregate Index. Similarly in 1999, the earnings yield on the S&P 500 was again below 50% of the yield on the Barclays Aggregate Index. However, at the end of Q1 2017, the S&P earnings yield was 140% of the yield of the Barclays Aggregate Index. No data are fully predictive, yet this is a relevant exercise in that many market observers compare current equity valuation data to the long-term historical averages. That approach is relevant, but it is also important to dig deeper to understand the full market and economic backdrop that contributed to that long-term average.
While some elements of current market conditions may resemble prior time frames, it does not appear that the valuation of broad equities is in the same relative positon as they were in 1987 or 1999. Surely, a decline can come at any time and for any reason. However, a resemblance of some metrics to 1999 or 1987 does not appear to be a likely potential culprit.
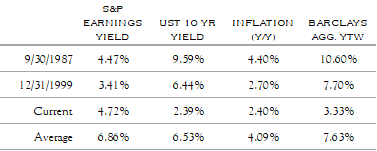
Source: Bloomberg, as of March 31, 2017
U.S. vs International
Rolling 3-Year Return
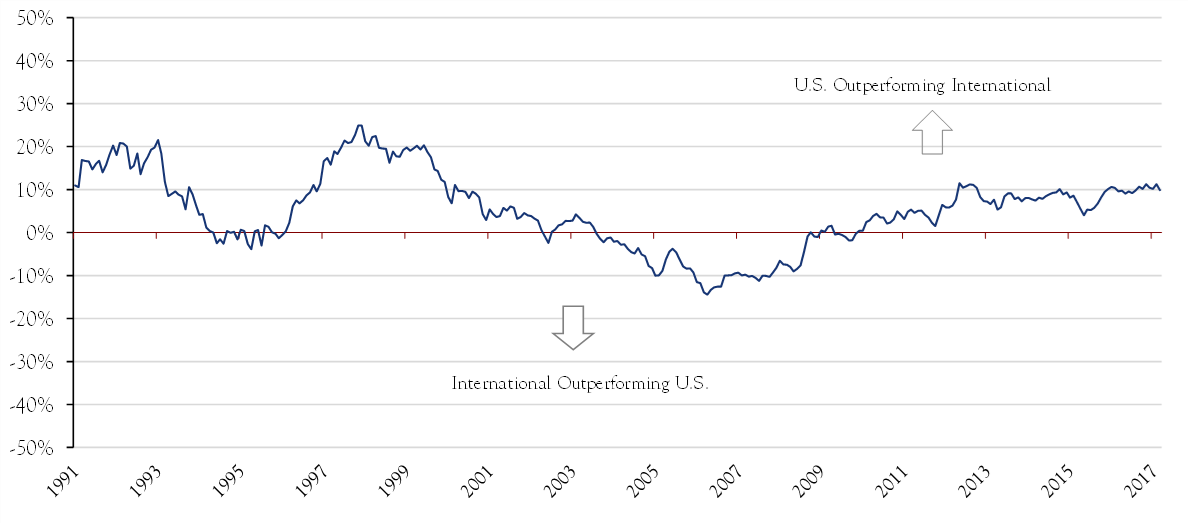
Source: Bloomberg, as of March 31, 2017
As shown in the chart, on a rolling three-year basis, U.S. equities have generally outperformed international markets for much of the past 25 years. While valuations in some international markets have perhaps become compelling, other issues remain such as demographic challenges and geopolitical risk factors. The emerging markets component within international markets does offer favorable demographics and present tense growth, but comes with an additional dose of volatility. Despite these challenges, international equities can be a good diversifying source of risk/return. Further, certain international markets offer a less crowded environment for active managers to identify and invest in high-quality companies, at compelling valuations.
Nominal Broad Dollar Index
Weekly as of April 2017
Source: Federal Reserve, as of March 31, 2017
Patrick Chovanec undertakes a Q&A on the nuances of the U.S. dollar and impact of strong and weak dollar. The chart above sets the backdrop of the trade weighted major currencies dollar index. Dollar strength/weakness has tended to ebb and flow in multi-year cycles. Patrick’s commentary provides some insight on how to think about the action and reaction impact of moves in the U.S. dollar.

Patrick Chovanec, CPA
Economic AdvisorBudget Reconciliation
read the insight
Roger W. Vogel, CFA
Managing Director, Portfolio ManagerPost-Election Equity Rally
read the insight
Patrick A. Bittner, CFA
Managing Director, Portfolio ManagerMunicipal Bond Update
read the insight
Martin Loeser
Head of Manager Research, Portfolio ManagerWhat to Make of Hedge Funds
read the insight
Patrick Chovanec, CPA
Economic AdvisorA Conversation on the U.S. Dollar
read the insightInvestment Outlook Summary
The Investment Policy & Strategy Group met in April 2017 to review asset allocation.
Equity
Equity allocations have been maintained at a level that is slightly above the midpoint of our range for the Income, Balanced and Growth objectives. Acknowledging that equity markets have advanced, we continue to emphasize the importance of rebalancing and thoughtful deployment of cash, consistent with client risk profiles. Trailing P/E ratios are above average, yet supportive of long term returns. We maintain a constructive view of equities over the 2-4 year time-horizon based on dividend yields, positive earnings trends and continued support for earnings multiples due to historically low (albeit potentially rising) interest rates and inflation.
Acknowledging that equity markets have advanced, we continue to emphasize the importance of rebalancing and thoughtful deployment of cash, consistent with client risk profiles.
With a backdrop of recent strength in equities, as well as diminished volatility, we recognize that a normal pullback in prices would not be unexpected. However, we do not attempt to forecast short-term market behavior. The continued evolution of the political climate, Fed Policy and geopolitical issues are contributing factors to short term volatility. However, this volatility becomes less of a factor as the investor’s time-horizon is extended.
Investment implementation across geography, market cap and investment style was maintained. In recognition of the potentially compelling valuations and long term return differentials, we will continue to closely examine allocations to non-U.S. equity. Many developed markets face ongoing political, demographic and growth challenges. Growth and demographics are more favorable in emerging markets, yet those markets can be impacted by “risk-off” and/or strength in the U.S. dollar. As we refresh our expected return outlooks across asset classes within equity, we will re-visit allocations as well.
Fixed Income
In fixed income, we continue to encourage prudence with regard to duration and credit. Cash equivalents and fixed income hedge funds are two strategies for limiting risk. We see relative value in municipal bonds for taxable investors.
In fixed income, we continue to encourage prudence with regard to duration and credit.
Alternatives
Within alternatives, customization is important. Objectives should be clearly defined and funds selected appropriately. Alternatives can be a useful tool for managing and diversifying risk in a portfolio.
Within the Growth objective, for more aggressive implementations and for those who can tolerate liquidity limitations in seeking a higher potential risk/return profile, we are incorporating two Private Equity allocations. Consistent with guidance last quarter, this allocation contains a core Private Equity allocation, as well as a more aggressive Private Equity allocation. The core allocation could consist of a multi-strategy large/mid cap private allocation, while the aggressive allocation could consist of allocations to more volatile strategies such as venture capital or growth.
Conclusion
As always, we will seek to add value to client portfolios over time by rebalancing allocations in anticipation of opportunities or in reaction to market developments in order to maintain the proper balance between risk and opportunity.
Market Monitor
This table provides a comprehensive view of returns across various markets and time frames. It is paired with a snapshot of economic data at the start of each time frame. This allows for comparison of annualized returns for a time frame while referencing the basic economic conditions in place in various periods.

Source: Bloomberg, data as of 5/31/2017. U.S. GDP and Unemployment figures are as of 4/30/2017.