
COVID-19 is essentially a natural disaster, quite possibly the largest and most widespread disruption since World War II. As with any disaster, the first chaotic phase consisted of economic and market destruction amidst rapidly spreading fear. We are now entering a new phase of taking stock and assessing options, as our knowledge improves and the virus curves bend a bit flatter, if not down.
Entering May, markets now confront the second phase—the great tug of war pitting the virus against modern medicine, fiscal and monetary stimulus, business innovation, and human compassion. We will see fits and starts on virus news—case counts, treatment options, progress on a vaccine—and continued bad news on the economic front, including large rises in unemployment and a lack of clarity on future growth and economic activity. Some individuals and companies will struggle mightily, and while various forms of stimulus and support will be helpful, there are no perfect solutions. There will be failures and bankruptcies, there will be survivors, and there will be “winners.” We believe the greatest chance to separate the companies which succeed from those which don’t will come from security selection, informed by rigorous analytic work, and an emphasis on high-quality balance sheets.
As markets often do, they run in front of news, anticipating the third phase of rebuilding and returning to normalcy. In this case, both the equity and credit markets have regained about half the ground lost in the declines, albeit with a lot of dispersion between segments. The third phase will unfold when the virus fades into terrible memory, whether from a vaccine (which many estimate as 12 months out), or from significant reduction of the virus due to testing, treatment, and modified personal behavior. At that point, many segments of the economy will significantly improve, leading to a return of long-term trends in economic and corporate profit growth.
Economic & Market Data
Markets rebounded sharply in April, with the S&P 500 producing a gain of +12.8%, leaving it down −9.3% for the year. While there was dispersion for individual stocks, the global markets, sectors, style, and market cap indices each posted gains for the month. This contrasted with negative headline economic data, driving home the point that markets not only reflect economic data but also sentiment and forward-looking expectations.
Economic data points paint an ugly picture. Jobless claims reported by the U.S. Department of Labor for the week ended April 25, were 3,839,000, bringing the four-week average to 5,033,250 weekly claims. For some context, this figure had been hovering just above 200,000 prior to COVID-19 and economic stoppages.
Unsurprisingly, this had a negative effect on consumer confidence. The benchmark University of Michigan survey of consumers saw a reading of 71.8 as compared with a pre-COVID February reading of 101.0. Both the survey’s current conditions and expectations components significantly declined.
Monthly estimates of economic activity showed massive declines. For example, the Richmond Fed Survey of service sector revenues for April declined to both its lowest reading on record, as well as its largest one-month drop. The New York Fed’s Empire State Manufacturing Survey covering data through April 10 also posted an historical low. The New York Fed conducted a supplemental survey report assessing fallout from COVID-19. This report clearly illustrates the divergences taking place in the service and manufacturing segments of the economy. As shown in the table below, high percentages of both services (Business Leaders Survey) and manufacturing (Empire State Manufacturing Survey) experienced significant disruption of revenue. One ray of light, perhaps, is that 17% of services and 30% of manufacturing reported no change or even higher revenue. Both segments also show north of 40% of businesses operating at or near normal levels, another 40% operating at a partial temporary shutdown, and less than 2% indicating a permanent total shutdown.
Supplemental COVID-19 Survey Report – New York Fed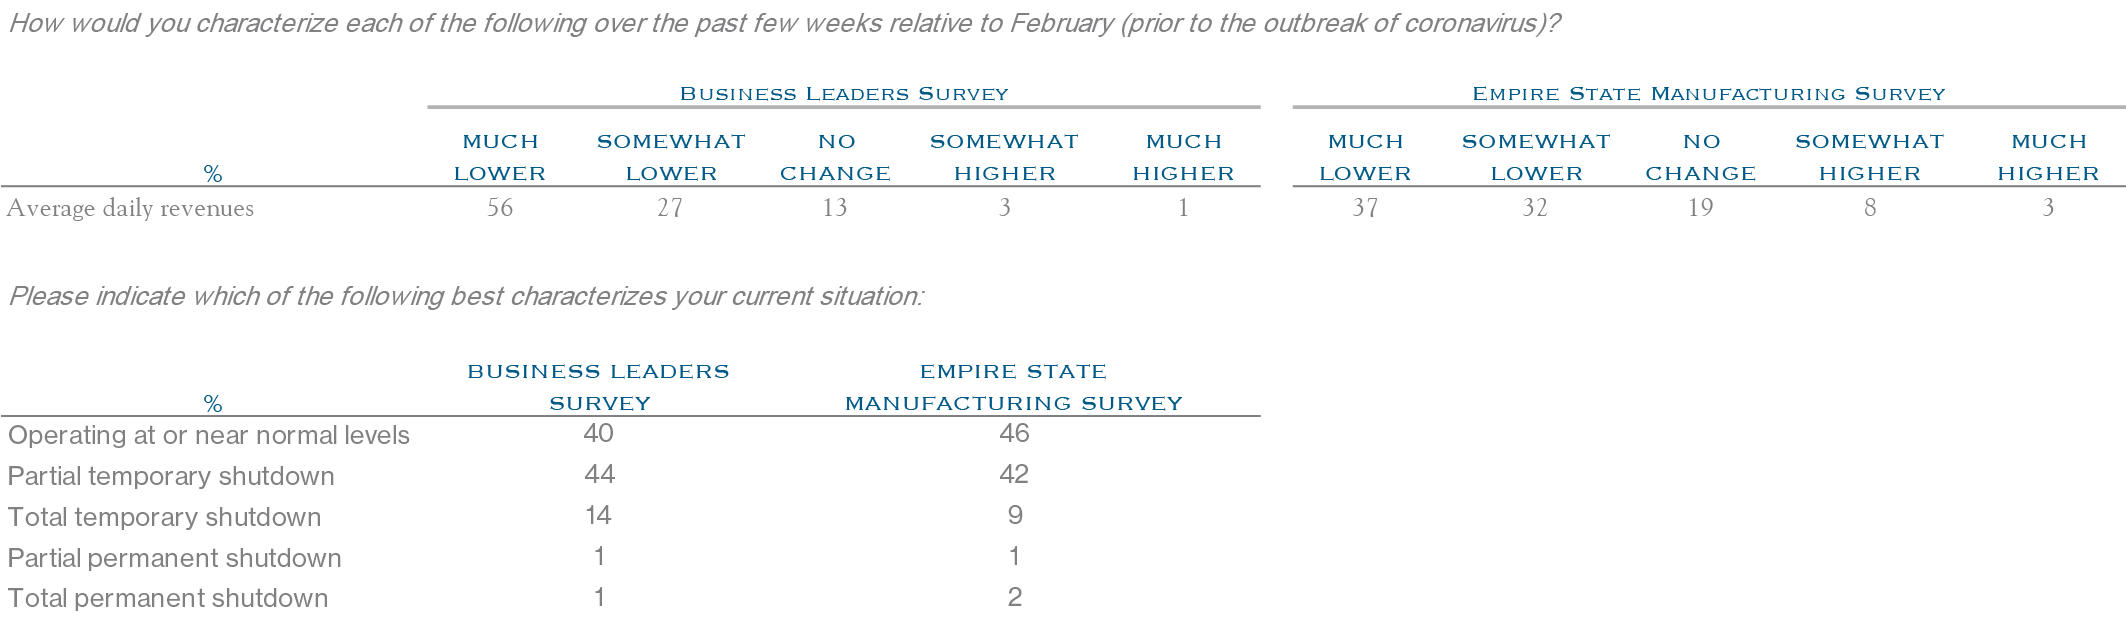
Source: New York Fed
Real Gross Domestic Product (“GDP”) decreased at an annualized rate of −4.8% in the first quarter of 2020. This was the worst figure since −8.4% in the fourth quarter of 2008 during the global financial crisis. Unfortunately, GDP is likely to continue to decrease since second quarter figures will include the brunt of economic destruction. Two procedural techniques are worth noting. First, reporting convention is to show annualized figures for the results of a quarter, making ugly declines appear larger than merited. Second, technical notes provided by the Bureau of Economic Analysis (“BEA”) outline how source data is incomplete and, in some instances, must be estimated for the third month of the quarter. Without delving too far into details, it is much more useful to accurately observe that GDP decreased significantly and not pay too much attention to the precision of calculations.
The overall takeaway is that headline figures for any economic metric are miserable and likely to remain so for the near term. Regardless, some portions of the economy are continuing to operate while the economy is locked in a massive tug of war against COVID-19, the resultant shutdowns, and fear that is limiting economic activity. Over time, humanity and medicine will prevail. In the near term, given the unreliability and noise in traditional measures of the economy, we must look to alternative signposts to gauge the pace at which economic activity is progressing, relative to “normal” levels seen prior to COVID-19.
Alternative Data
Weekly jobless claims and measures of weekly activity from the New York Federal Reserve will be helpful as economic re-openings occur. In the meantime, alternative indicators of economic life show some slow progress in the more troubled areas of the economy, such as air travel, hotels, and consumer foot traffic. As an example, U.S. air passenger travel as measured by TSA checkpoint tallies shows 171,563 passenger travelers on May 1. While this is the highest figure reported since March 29, it is also only 7% of the figure recorded on a comparable day of the week in 2019 when over 2.5 million travelers were counted. Other travel-related metrics, such as hotel room occupancy, also ticked higher, though remain at depressed levels. STR calculates hotel room occupancy at 26%, up from a low around 20%. Adara calculates hotel bookings at about 16% relative to January 2020, up from 6% in mid-April. Measures of foot traffic by various vendors show a similar pattern—massive declines, followed by small upticks in recent days and weeks. Unsurprisingly, grocery stores continue to see strong traffic, while restaurants and bars do not. As an example, data from OpenTable shows restaurant reservations down −98% in the U.S., though web searches for restaurants are increasing and some metro areas have picked up a bit. New York’s Metropolitan Transportation Authority and San Francisco’s Bay Area Rapid Transit system each show daily rider counts, providing another daily metric to monitor for signs of increased activity.
Looking Ahead
There are signs of progress reducing the virus’s spread through physical distance and increased usage of masks, and there is hope for medical advances to create courses of treatment or a vaccine. Numerous sources report around 100 candidates for vaccine with about ten in formal trials as all manner of technology, dollars, and regulatory reform is being deployed to speed the process.
The tug of war won’t be won until the virus is eliminated, though a move away from the worst is underway. In the current phase, each piece of data regarding the virus and the economy will be closely scrutinized for which way things are headed. In the near term, this means volatility will likely persist, while the longer-term path to recovery remains favorable for the economy and markets.
This communication contains the personal opinions, as of the date set forth herein, about the securities, investments and/or economic subjects discussed by Mr. Teeter. No part of Mr. Teeter’s compensation was, is or will be related to any specific views contained in these materials. This communication is intended for information purposes only and does not recommend or solicit the purchase or sale of specific securities or investment services. Readers should not infer or assume that any securities, sectors or markets described were or will be profitable or are appropriate to meet the objectives, situation or needs of a particular individual or family, as the implementation of any financial strategy should only be made after consultation with your attorney, tax advisor and investment advisor. All material presented is compiled from sources believed to be reliable, but accuracy or completeness cannot be guaranteed. © Silvercrest Asset Management Group LLC

