
The instructions from the chemistry teacher were clear: “I need a number AND a unit,” stressing the importance of pairing the two to provide clarity in answering a question. Sadly, market prognosticators are missing half of the answer, often providing theories but no numbers—a missed opportunity. To better forecast, we need a theory AND a number. Thankfully, numbers are readily available.
Real-time economic information has exploded in recent years. Metrics on spending and mobility, categorized across industries, data aggregation in economic models, freight and shipping figures, and the explosion of services offering “alternative data” provide a fairly comprehensive view of the current activity level in the U.S. economy. Consider that before the 2020 COVID recession, the most recent quarter-on-quarter negative economic activity in the U.S. was in 2014. At that time, guesswork was a core component of economic forecasting.
The art form has evolved to include numbers, and “now-casting” has exploded in availability and efficacy:
- The Atlanta Fed created its GDP Now metric in 2011 and made it available online to the public in 2014.
- The New York Fed unveiled its Weekly Economic Index in 2020.
- In response to the pandemic in 2020, many other data sets came into being.
In 2020, the economy abruptly fell into recession. As growth slows and eventually turns negative, it is far more common to slide into recession. Our work shows that a typical path is for the economy to slow for about two quarters (1.7) before posting a negative reading. Given the availability of data, it seems likely that declines in actual activity are far better predictors of oncoming recession than any tools available in prior recessions. For the past three quarters, the economy has been expanding at an increasing rate, though we expect that trend to end and that future quarters will expand at slower rates.
Presently, the Atlanta Fed’s GDP Now model shows growth of +2.1%, and the New York Fed’s Weekly Economic Index has growth running at +2.3%. The Johnson Redbook same-store sales indicator has been running between +4% and +6% on a year-over-year basis in recent weeks. Credit card vendor data, data from mobility measurement services, and other “real-time” data show similar trends. Growth is coming from a continued expansion in the total number employed and wage gains of +4.1% on a year-over-year basis as measured by the Bureau of Labor Statistics Average Hourly Earnings.
The above data corresponds with an economy that is still expanding, though trends in job gains and spending data are slowing. We expect the economy to continue to expand at roughly 2.0% in the coming quarters. That growth rate would align with long-term trends driven by population growth and productivity.
Slow and steady economic growth is ordinarily consistent with modest earnings expansion. However, companies do have the opportunity to expand margins, given the widespread availability of efficiency-enhancing tools such as robotics and artificial intelligence. With a decent but slowing economy and sound margin management, we look for earnings gains in the mid-single digits in 2024.
Valuation remains an essential part of the equation. The S&P Index is trading at around 4,550, or approximately 20.5x expected 2023 current-year earnings of $222. For next year, consensus expectations are for $245 in earnings, while we expect a more modest $235. That represents a Price/Earnings ratio of around 19x. In other words, stocks aren’t “cheap” vs. historical markers.
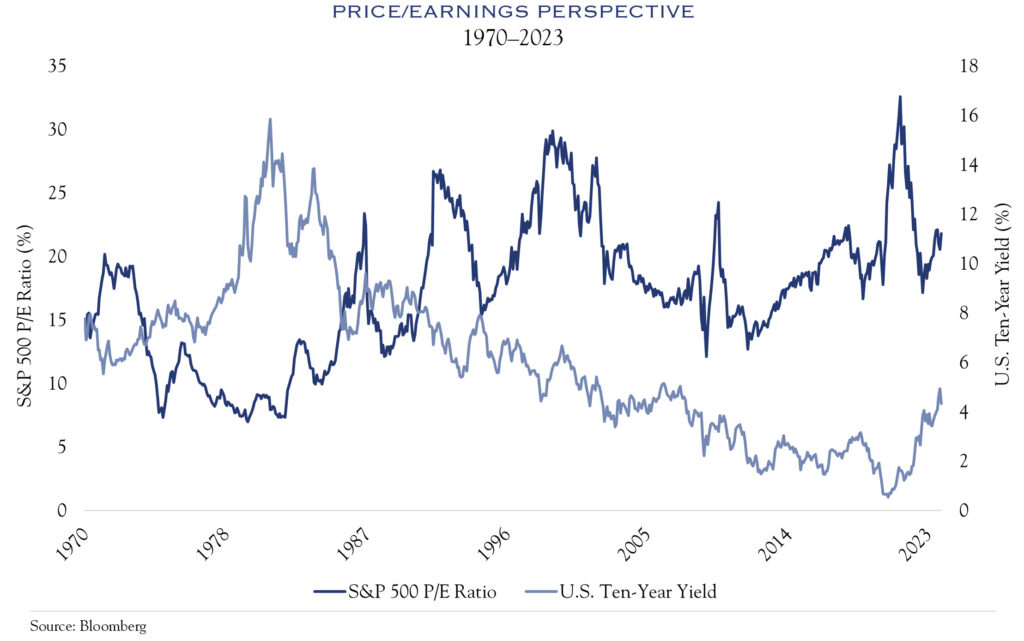
However, valuations could still expand somewhat, especially as the outlook for interest rates improves. Consider the recent rally in equities: as the yield on the U.S. Ten Year note declined from nearly 5.0% to 4.3%, stocks are approaching a 10% gain. Next year, we could see more of the same. Inflationary pressures are waning, and the possibility has emerged for rate cuts from the Fed in 2024. The Fed will be reluctant to move in an election year; however, rates will become overly restrictive and unnecessarily high if inflation continues to decline. Early signals point to inflation of around 2.5% as a trigger for rate cut discussions. Thus, sometime in 2024, the Fed is likely to shift focus to a decision on when to cut rates, which would most likely lead to further rallies in bonds and reductions in yields.
Overall, we look for slow gains in earnings, declines in yields, and a slight increase in valuation to power a modest advance in stocks and bonds.
This communication contains the personal opinions, as of the date set forth herein, about the securities, investments and/or economic subjects discussed by Mr. Teeter. No part of Mr. Teeter’s compensation was, is or will be related to any specific views contained in these materials. This communication is intended for information purposes only and does not recommend or solicit the purchase or sale of specific securities or investment services. Readers should not infer or assume that any securities, sectors or markets described were or will be profitable or are appropriate to meet the objectives, situation or needs of a particular individual or family, as the implementation of any financial strategy should only be made after consultation with your attorney, tax advisor and investment advisor. All material presented is compiled from sources believed to be reliable, but accuracy or completeness cannot be guaranteed. © Silvercrest Asset Management Group LLC

