
“Markets were really volatile!” Headlines like this were common in the fourth quarter of 2018, especially in December. They highlight the need to revisit the idea of volatility, to ask what it means to say the markets were volatile, to assess whether they were, and to see how it matters.
With the S&P 500 down a lot in the last quarter of 2018, especially through Christmas Eve, it would be easy to equate volatility with falling markets. Volatility does sometimes make headlines in rising markets (such as during the Tech Bubble of the late 1990s or in cryptocurrencies in 2017), but the more common association is with markets that are going down. While falling markets and volatility often occur at the same time, they are not the same—falling markets simply focus our attention on volatility.
A working definition is in order. Volatility is a statistical measure, typically standard deviation, of dispersion in a numerical data set. In the investment world, this data set is usually the returns for an investment over a period of time—for example, daily, monthly, quarterly, or annual returns. Dispersion is how far the individual returns are from the average of the group. Graphically, it looks like this:
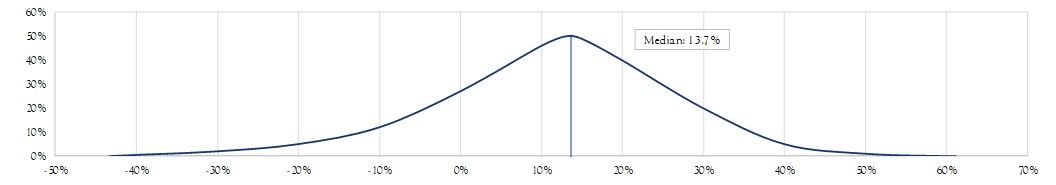
Performance distributions risk & reward— one year returns (Jan 1950— Sept 2018):
STOCKS— S&P 500 INDEX
BONDS— INTERMEDIATE TREASURY BONDS
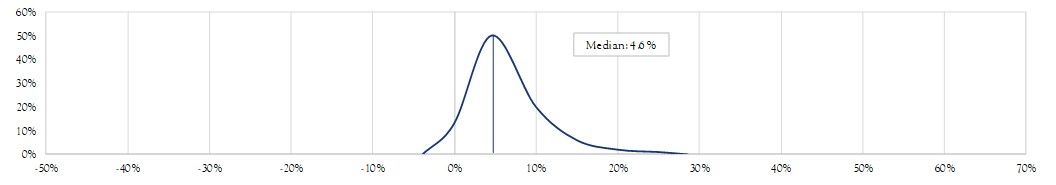
Source: Crandall, Pierce & Company
These graphs illustrate the idea of dispersion and, by extension, the relative volatility. The math behind this captures the same idea—it starts with the average return, calculates the “distance” from that average to each data point, and takes the average of those distances. The resulting number is the standard
deviation—volatility—of the data.
But saying something is volatile, or not, is not particularly useful. It becomes useful if this knowledge is coupled with one more assumption: that the data has a predictable distribution. Many data sets, when graphed as a histogram, like those below, exhibit a familiar bell-curve shape. One common form of this curve is called the normal distribution, which has very useful properties. If you know the average and standard deviation of a normally distributed data set, you know what the histogram looks like and also that a specific percentage of any group of data points should fall within one, two, and three standard deviations of the average. While equity returns are known to follow a somewhat different distribution, these properties of a normal distribution are still useful—with a key caveat—when thinking about expected returns and evaluating current results. The caveat is that negative equity returns happen more often, and are worse in the extremes, than a normal distribution would indicate. In other words, the distribution of equity returns has a “fat left tail.”
Returns from the S&P 500 Index help illustrate the usefulness of combining volatility and the normal distribution. Annual returns since 1950 (69 years), have averaged 12.5%, and the volatility (standard deviation), of those returns has been 17.1%. As a guiding idea, we would expect that about 2/3 of the years (data points) would fall with one standard deviation on either side of that average—so between +29.6% and −4.5%. This matches the data—45 years were in that range. Looking at a wider range—within two standard deviations, one might expect about 95% of the years, so 65 or 66 years. In fact, the number is 65, with 1 outside the range to the high side, and 3 below the lower bound. One last check is that ~99% should fall within three standard deviations (+63.8 to −38.7%). In this case, all (100%) of the years are in this range, although 2008, at −37.0%, comes quite close to the edge of the range. Overall, this data fits the properties of a normal distribution well (and does not have a notably fat left tail). More generally, data sets can be less well behaved, and should always be used with caution and a bit of skepticism. At the same time, these properties can be useful as a first approximation, or rule of thumb, when thinking about volatility in a portfolio and the market.
Volatility is a statistical measure, typically standard deviation, of dispersion in a numerical data set.
To do this effectively, we should keep two important facts in mind. First, volatility changes meaningfully over time. U.S. equity volatility, for example, has experienced extended lulls and dramatic spikes. Since the level of volatility can change rapidly, it is important to keep in mind the larger context—that these lulls and spikes are only part of the story. Measures of long-term average volatility provide that context. Second, volatility differs depending on how it is measured. Daily data is bumpier, capturing more ups and downs, while monthly, quarterly or annual data smooths out the bumps. As a result, volatility measured using daily data is higher than volatility measured using data from longer time periods. In a similar vein, measuring market moves from peak to trough is the bumpiest of all—it presents an extreme view of volatility. Despite these facts, it is often the case that market watchers—primarily those with a view to create eye-catching headlines—speak in terms of volatility from a market lull (perhaps even measured with monthly data), and apply it to a peak-to-trough drawdown.
First, volatility changes meaningfully over time… Second, volatility differs depending on how it is measured.
U.S. markets in late 2018 demonstrate how impactful—and misleading—this can be. The market had been in a lull over the last couple of years leading up to October. Daily volatility over the prior two years was just over 10%—far below the long-term average of about 17%. Yet, from the peak in October the market dropped over 20% and almost 16% in just a few weeks through the close on Christmas Eve. Measured using recent volatility, the move since October was over four standard deviations, and over six in December! Through this lens, these moves were truly shocking, with odds of them happening far less than 1 in 100. However, using a longer-term average volatility, and focusing on trailing returns rather than peak to trough, the numbers are very different. On a trailing month, quarter, and year, it was far less unusual, at just over 2 standard deviations (so odds closer to 1 in 20 than even 1 in 100) for the month and quarter, and only 0.6 (down just under 10%) for the year. It is easy to imagine one investor thinking “A six standard deviation move! Once in a zillion years! Sky is falling!” while another thinks “Pretty much as expected over our investment horizon.”
These different views of the same market event can impact decision making in important ways. In the former case, it is easy to see how an investor might panic, or at least conclude that extreme measures such as exiting the market are warranted. By contrast, by avoiding the complacency engendered by the lull and focusing on time horizons that are less circumstantial and more relevant to sound investment decisions, a different investor might see the move as somewhat unusual and noteworthy, but within expectations. This, in turn, might have highlighted an opportunity for portfolio rebalancing, or perhaps in recognizing the extremity of the move in December, even increasing exposures.
The market was volatile at the end of the year! And while it is easy to understand the screaming headlines, proper context for and measurement of that volatility would have enabled better choices while weathering the storm.
This communication contains the personal opinions, as of the date set forth herein, about the securities, investments and/or economic subjects discussed by Mr. Morris. No part of Mr. Morris’s compensation was, is or will be related to any specific views contained in these materials. This communication is intended for information purposes only and does not recommend or solicit the purchase or sale of specific securities or investment services. Readers should not infer or assume that any securities, sectors or markets described were or will be profitable or are appropriate to meet the objectives, situation or needs of a particular individual or family, as the implementation of any financial strategy should only be made after consultation with your attorney, tax advisor and investment advisor. All material presented is compiled from sources believed to be reliable, but accuracy or completeness cannot be guaranteed. © Silvercrest Asset Management Group LLC

