1. Expanded Opportunity Set
The expansion of global equity investing over the past four decades is nothing short of remarkable. The 30x growth from $2.5 trillion in global market capitalization to over $75 trillion correlates with the rise in the number of listed companies from 17,273 to 43,036 today. In the 1980s, the value of global equity trading was barely 20% of the value of global GDP; these days, the value of global equity trades ($117 trillion) is 20% larger than global GDP. (Source: Worldbank)
Most of this growth has occurred beyond the borders of the United States. In 1970, U.S. equities accounted for 70% of the global stock market capitalization, by 1980, the U.S. accounted for 54% of global equity value, and today the U.S. accounts for 41%. While this is still the lion’s share of global equities, if wealth creation is positively correlated with stock market growth and the U.S. accounts for only 24% of global GDP, we would expect the trend towards a greater non-U.S. share of global equity markets to continue.
In the 1980’s, the value of global equity trading was barely 20% of the value of global GDP; these days, the value of global equity trading is $177 trillion, 20% larger than global GDP.
For further historical perspective, in 1980, MSCI considered 19 countries to be in the “global equity opportunity set,” all of them developed and most of them located in North America and Europe. Today, MSCI tracks performance and constructs indices on 76 developed, emerging, and frontier stock markets on seven of the eight continents (someday, perhaps, Antarctica!).
2. Exposure To Quality and Scale
Publicly-traded, non-U.S. companies now occupy many of the top 10 positions by size in all 11 sectors, including 8 of the top 10 positions in Materials, 5 of the top 10 positions in Energy and Financials, and 3 of the top 10 positions in Consumer Discretionary, Consumer Staples, and Utilities. (Source: Morningstar, based on market capitalization of MSCI ACWI, as of 12/31/18).
3. Cyclicality of U.S./Non-U.S. Outperformance
Geographic diversification also takes advantage of the cyclicality of leadership in stock market returns. If we look at the returns of the S&P 500 versus the MSCI EAFE over the past 40 years, it becomes clear that each allocation has its run of outperformance versus the other. For the past few years, the U.S. has prevailed, but history tells us that we will cycle in the other direction.
MSCI EAFE index vs. S&P 500 Total Return index
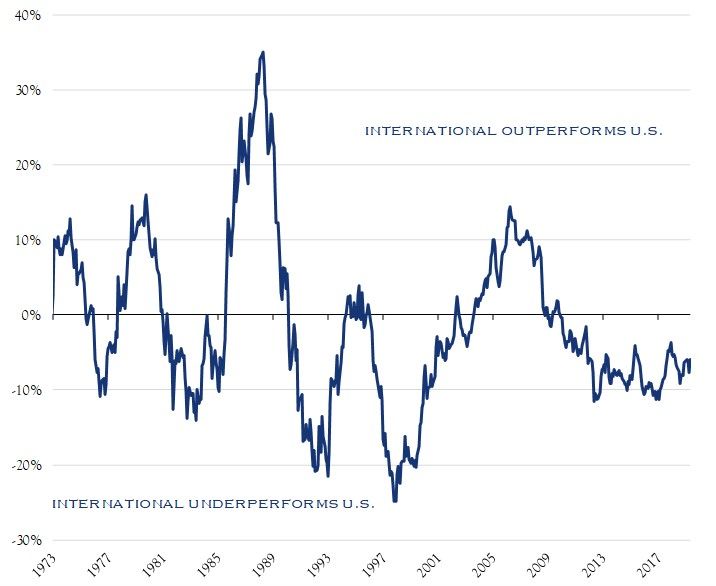
Source: PerTrac
Projected Economic Growth Over the Next Five Years
Real GDP Growth, 2019–2024
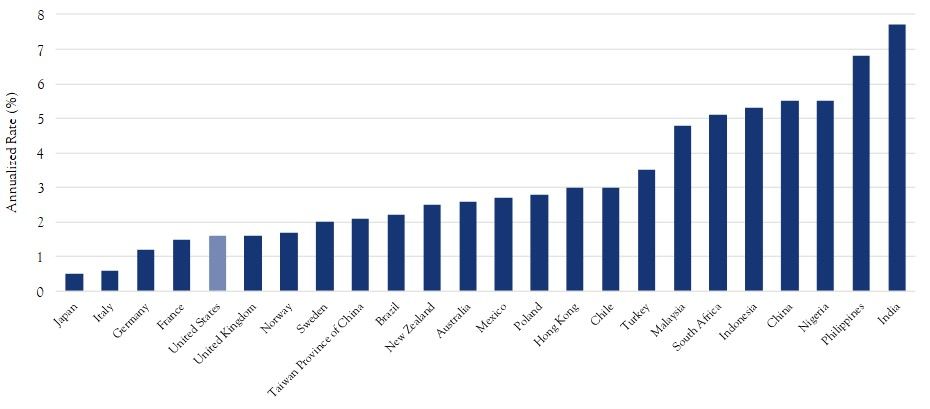 Source: IMF
In terms of individual stock markets, the top and bottom slots for annual performance change year to year, with the U.S. rarely leading in any individual year. In fact, despite its 10-year bull market run, the U.S. has only been the top performing market once over the past decade.
4. Exposure To Higher Growth Rates
Non-U.S. stock markets offer the investor exposure to higher rates of economic growth via exposure to emerging and frontier economies. Overall, global economic growth is expected to be about 2% over the next 20 years, which is about the same rate as is projected for the U.S. However, exposure to Indian, Indonesian, Brazilian, and Chinese economies exposes investors to economic growth rates almost double the U.S. and global projections.
5. Exposure To Attractive Valuations
Exposure to non-U.S. markets also gives the investor the opportunity to take advantage of differences in valuation between the U.S. and overseas markets. The average forward price-to-earnings ratio of the iShares Core S&P 500 ETF is currently 19.9x, versus 13.8x for the iShares ACWI ex U.S. ETF, and 12.0x for the iShares MSCI Emerging Markets ETF. Given the strong historic evidence that lower forward price-to-earnings ratios are associated with higher future returns, the current discount on international earnings is worth taking into consideration. Given the strong historic evidence that lower forward price-to-earnings ratios are associated with higher future returns, the current discount on international earnings is worth taking into consideration.
For the past few years, the U.S. has prevailed, but history tells us that we will cycle in the other direction.
This communication contains the personal opinions, as of the date set forth herein, about the securities, investments and/or economic subjects discussed by Mr. Richey. No part of Mr. Richey’s compensation was, is or will be related to any specific views contained in these materials. This communication is intended for information purposes only and does not recommend or solicit the purchase or sale of specific securities or investment services. Readers should not infer or assume that any securities, sectors or markets described were or will be profitable or are appropriate to meet the objectives, situation or needs of a particular individual or family, as the implementation of any financial strategy should only be made after consultation with your attorney, tax advisor and investment advisor. All material presented is compiled from sources believed to be reliable, but accuracy or completeness cannot be guaranteed. © Silvercrest Asset Management Group LLC