
Numerous books reference a concept often attributed to Galileo, stating that math is the language of the universe—an excellent tool for communication. These communicative properties are not predictive properties. Yet, they can allow for a factual examination of past and present conditions. Data, paired with experienced judgment, is the best approach to navigating markets. We embark on a journey through the major bull and bear markets dating back to 1965, painting a picture of key market and economic factors along the way.
Unsurprisingly, there is no predictive pattern hidden in the data. However, each era has generally had a defining characteristic—often one that resonates in the memory of experienced investors. For example, the financial markets word association for the 1970’s is inflation. Likewise, 2008 is defined by the Global Financial Crisis. Other times, absent inflation or recession, core fundamentals, such as earnings and valuation, play a key role. It is for this reason that a key input to our current view is growth in dividends and earnings.
Each era has generally had a defining characteristic—often one that resonates in the memory of experienced investors.
“Excellence in statistical graphics consists of complex ideas communicated with clarity, precision, and efficiency.”1
–Edward R. Tufte
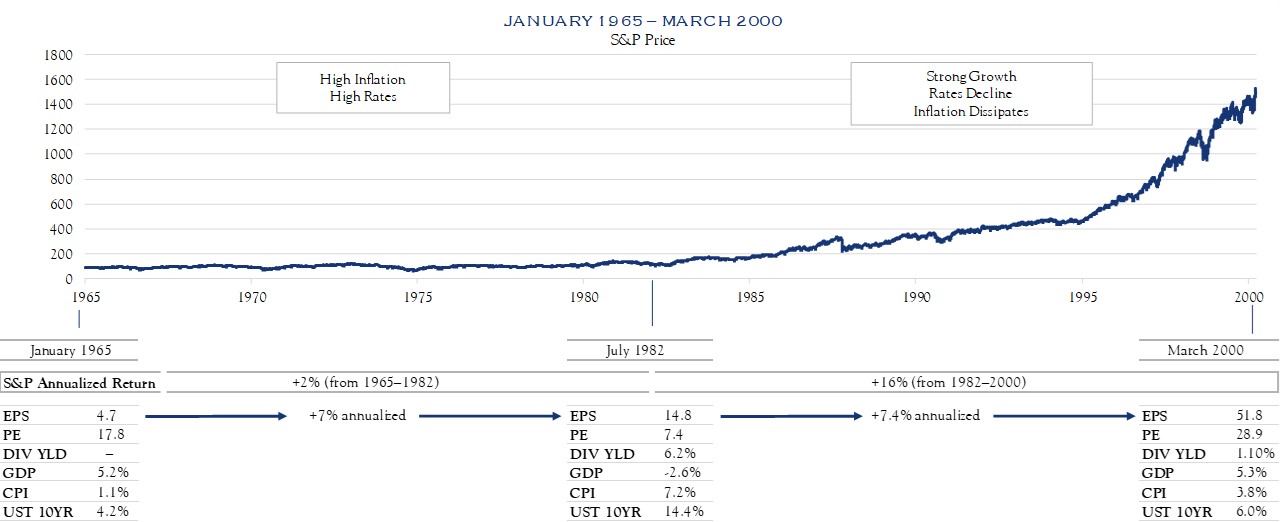
In that spirit, what follows are three visuals consisting of a graph of S&P 500 price performance paired with a table of key market statistics. Market fundamentals are represented by earnings, price/earnings multiple, and dividend yield. Economic statistics are represented by GDP growth rate, Consumer Price Index (CPI) and the yield on the U.S. 10-Year Treasury bond.
Source: Bloomberg
The Inflation Era
While earnings increased at a 7% annualized rate, the period of 1965–1982 was dominated by inflation with CPI nearing a peak of 15% and averaging nearly 7% over the era. Against this backdrop, stocks merely marked time, clocking in with a 2% annualized return. This era is responsible for the well-founded belief that strong inflation can be the dominant factor, overwhelming other fundamentals. There is an intuitive reality supporting this concept as inflation erodes the value of future dividends and earnings.
Earnings + Internet = Tech Bubble
While the fee for an S&P 500 ETF was quite low, the price paid for the underlying 500 companies was quite high.
During the bull market, which ran from 1982 to the peak of the internet bubble in 2000, earnings continued to grow at a 7% annualized rate. However, with muted inflation and enthusiasm around technology, the price being paid for those earnings expanded from 7.4 to 28.9. Herewith is support for the concept that bubbles can distort markets. This is noteworthy especially for those who merely invest in S&P 500 ETFs. As the 2000s demonstrate, the index can, at times, seem to violate the efficient markets hypothesis. While the fee for an S&P 500 ETF was quite low, the price paid for the underlying 500 companies was quite high.
Source: Bloomberg
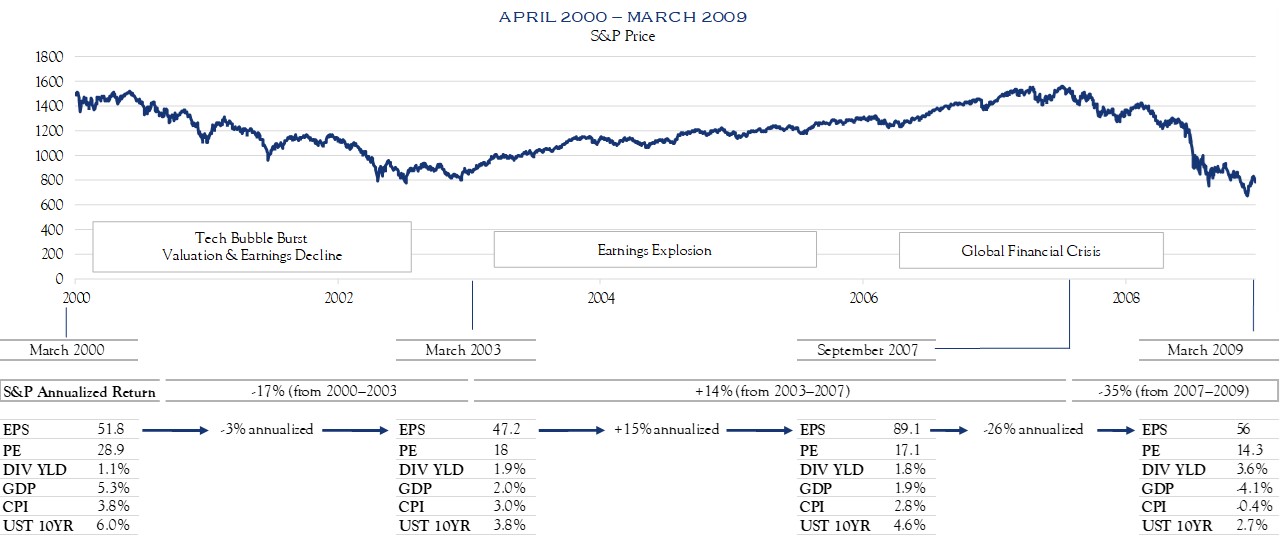
The Bubble Deflates
While there are some echoes of tech enthusiasm in today’s market, the earnings picture in tech is generally quite different.
As it turned out, the Y2K bug had nothing to do with systems requiring four digits to accurately reflect the year within a date. Rather, the Y2K bug manifested itself in the realization that paying for eyeballs wasn’t a good fundamental practice. From 2000–2003, earnings declined slightly and enthusiasm ebbed in a meaningful way with the price/earnings ratio declining from 29 to 18. While there are some echoes of tech enthusiasm in today’s market, the earnings picture in tech is generally quite different.
Earnings + Housing Boom = Global Financial Crisis
It is tempting to oversimplify—to a conclusion—that the entire period was a financially engineered boom and bust.
From 2003 to 2007, earnings grew quickly, while other statistics showed less change. That same earnings growth reversed course during the Global Financial Crisis. As such, it is tempting to oversimplify—to a conclusion—that the entire period was a financially engineered boom and bust. The reality is more complex, but the experience reinforces a view that a recession is a dominant influence on markets.
Source: Bloomberg
1 As of June 30, 2018
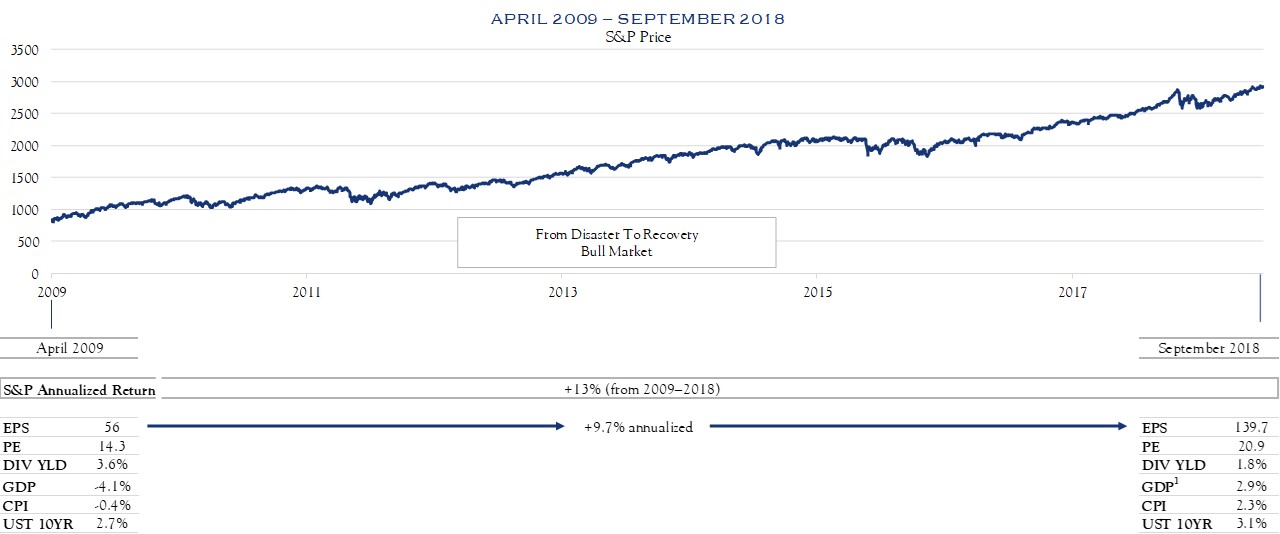
Onward…
As the calendar turns to the autumn months, many are wondering whether the investment climate will begin to cool. The bull market run from 2009 has seen earnings growth expand at nearly a 10% annualized rate and the price/earnings ratio has expanded to 20.9.
However, both GDP and inflation appear stable. Absent recessionary or inflationary pressures, we base our three-year forward-looking view on stock price appreciation coming from earnings growth and dividends.
This communication contains the personal opinions, as of the date set forth herein, about the securities, investments and/or economic subjects discussed by Mr. Teeter. No part of Mr. Teeter’s compensation was, is or will be related to any specific views contained in these materials. This communication is intended for information purposes only and does not recommend or solicit the purchase or sale of specific securities or investment services. Readers should not infer or assume that any securities, sectors or markets described were or will be profitable or are appropriate to meet the objectives, situation or needs of a particular individual or family, as the implementation of any financial strategy should only be made after consultation with your attorney, tax advisor and investment advisor. All material presented is compiled from sources believed to be reliable, but accuracy or completeness cannot be guaranteed. © Silvercrest Asset Management Group LLC

